Curated OER
Simple Bar Graphs Using Excel
Students create original survey questions, and develop a bar graph of the data on paper. They input the survey data using two variables onto an Excel bar graph spreadsheet.
McGraw Hill
Glencoe: Self Check Quizzes 1 Making Predictions
Use Glencoe's randomly generated self-checking quiz to test your knowledge of making predictions using surveys. Each question has a "Hint" link to help. Choose the correct answer for each problem. At the bottom of the page click the...
National Council of Teachers of Mathematics
The Math Forum: Seventh Grade Mathematics: Data Sense
This site has some interesting ways to collect and evaluate data. There are some activities about note taking, spreadsheets, surveys, and a cool bridge construction project. Teachers may want to use this site as a resource for some...
Math Is Fun
Math Is Fun: Survey Questions
This resource outlines how to create a good questionnaire - the types of questions to ask, the types of responses you can get, how to order the questions, and how to display the results. Very nicely laid out!
Web Center for Social Research Methods
Research Methods Knowledge Base: Constructing the Survey
Provides guidelines for how to structure a survey. Click on the links in the sidebar to access all materials in this section. Subtopics include: types of questions, content of questions, response format, wording of questions, and...
National Council of Teachers of Mathematics
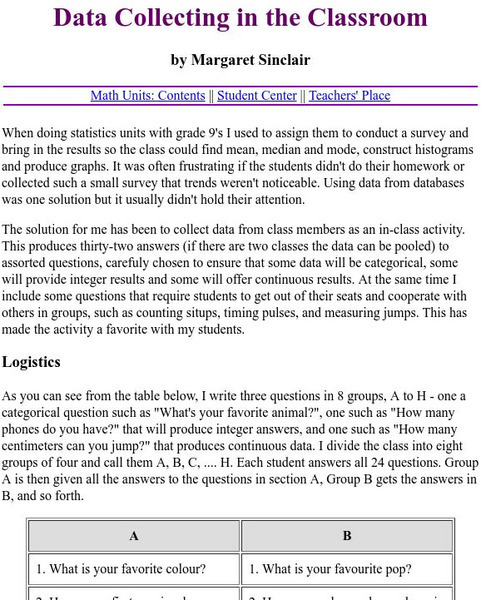
The Math Forum: Data Collecting in the Classroom
A list of two dozen questions students can easily ask eachother in the classroom to quickly collect data in hopes of using it in their study of making graphs. Some are opinion questions, while others require the counting of certain items...
Online Writing Lab at Purdue University
Purdue University Owl: Creating Good Interview and Survey Questions
This entry focuses on writing good interview and survey questions when conducting primary research. It warns againgst questions that are bias, wordy, double-barreled, and unrelated and provides examples of each.
PBS
Pbs Kids Zoom: Flu Survey
Get the latest survey results from ZOOMers that had the flu this past winter. Get all the survey details here.


