Curated OER
How Do You Make a Scatter Plot?
So you've got some x-values and some y-values and you want to make a scatter plot. First thing is to make a table for your x and y values. Then make ordered pairs and you can plot them.
Curated OER
How Do You Rotate a Figure 90 Degrees Clockwise Around the Origin?
Show your class how to rotate a figure 90 degrees clockwise around the origin of a coordinate plane. The lecturer explains the concepts and steps involved in reflecting a figure across the y-axis. Consider providing this for learners as...
Curated OER
How Do You Rotate a Figure 270 Degrees Clockwise Around the Origin?
Pupils who view this tutorial will gain a better understanding of how to rotate a figure around the origin of a coordinate plane. This video covers how to rotate clockwise and counterclockwise to achieve the same purpose. Show this video...
Curated OER
How Do You Graph Ordered Pairs in Each Quadrant?
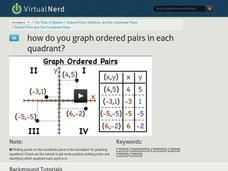
Draw a graph, label your units, make a table of your given coordinates. Now plot your points, label each point as you graph it. Next identify the quadrant that each point is in and add that to your table.
Curated OER
How Do You Rotate a Figure 180 Degrees Around the Origin?
Demonstrate how to rotate a figure around the origin of a coordinate plane. The instructor in this video tutorial explains the concept deliberately, showing how to complete the rotation as she presents the information. After she finishes...
Curated OER
What is the Y-Axis?
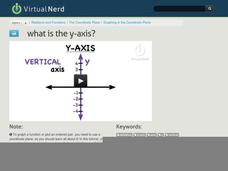
Just a simple straightforward definition and example of what constitutes the y-axis.
Curated OER
What is the X-Coordinate?
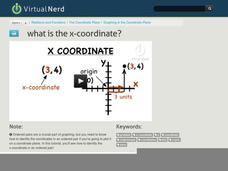
How are ordered pairs, coordinate points, and graphing related to each other? What is the importance of the x-coordinate? Does it matter what order you write an ordered pair in? Yes! The x-coordinate is always written first. Always! And...
Curated OER
What is the X-Axis?
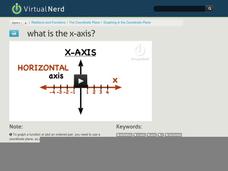
Just a simple straightforward definition and example of what constitutes the x-axis.
Curated OER
What are Quadrants in the Coordinate Plane?
The teacher diagrams a coordinate plane and identifies the four quadrants. He labels the quadrants with numbers. Then he illustrates a table to identify the positive or negative value of the x-coordinate and the y-coordinate and...
Curated OER
How Do You Find the Zeros of a Quadratic Function on a Graph?
Find the zeros on a given graph of a quadratic equation. What does this mean? It means to find the values at which the parabola crosses the x-axis. It seems pretty straightforward to be able to look at a graph and identify the points at...
Curated OER
How Do You Graph a Quadratic Equation with No Solution?
There are many ways to solve a quadratic equation. Let's check out how to solve a quadratic equation by graphing. But first, let's find the axis of symmetry and the vertex before making a table of values. Write the values as ordered...
Curated OER
How Do You Find the X-Coordinate of a Point on a Line If You Have Another Point and the Slope?
Use the slope formula to find the missing coordinate. You've been given all the needed information to solve this problem. So all you need to do is plug in the values and solve for the missing variable value.
Curated OER
How Do You Rotate a Figure 90 Degrees Clockwise Around the Origin?
Show your class how to rotate a figure 90 degrees clockwise around the origin of a coordinate plane. The lecturer in this video explains the concepts and steps involved in reflecting a figure across the y-axis. Consider providing this...
Curated OER
How Do You Rotate a Figure 270 Degrees Clockwise Around the Origin?
Pupils who view this tutorial will gain a better understanding of how to rotate a figure around the origin of a coordinate plane. This video covers how to rotate clockwise and counterclockwise to achieve the same purpose. Show this video...
Curated OER
How Do You Rotate a Figure 180 Degrees Around the Origin?
Demonstrate how to rotate a figure around the origin of a coordinate plane. The instructor in this video tutorial explains the concept deliberately, showing how to complete the rotation as she presents the information. After she finishes...
Curated OER
How Do You Graph Ordered Pairs in Each Quadrant?
Draw a graph, label your units, make a table of your given coordinates. Now plot your points, label each point as you graph it. Next identify the quadrant that each point is in and add that to your table.
Curated OER
How Do You Use a Graph to Reflect a Figure Over the X-Axis?
A reflection is just what you think it is, a mirror image. So how do you reflect a figure on a graph? Just flip it over. The teacher illustrates how to select a line of reflection (the x-axis) and make the calculations to flip the figure.
Curated OER
How Do You Make a Scatter Plot?
So you've got some x-values and some y-values and you want to make a scatter plot. First thing is to make a table for your x and y values. Then make ordered pairs and you can plot them.
Curated OER
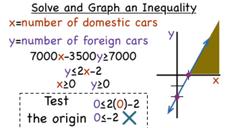
How Do You Solve and Graph Inequalities from a Word Problem?
Are you befuddled after reading this word problem? Not only is it a word problem but there are two variables, and not only does it have two variables, but it is an inequality. Don't pull your hair out! Take a deep breath and watch this...
Curated OER
What's the Y-Intercept?
In a linear equation, the y-intercept is really just the point where the graph of the line crosses the y-axis.
Curated OER
What's the X-Intercept?
In a linear equation, the x-intercept is really just the point where the graph of the line crosses the x-axis.
Curated OER
How Do You Find the X- and Y-Intercepts of a Line If You Have a Graph?
The x-intercept is the point at which the line of the equation crosses the x-axis. The y-intercept is the point at which the line of the same equation crosses the y-axis. It's as easy as that. Look at your graph and note these locations.
Curated OER
How Do You Use Coordinates to Reflect a Figure Over the X-Axis?
Perform a reflection of a figure over the x-axis. This seems pretty straightforward. But also learn how to use the coordinates to reflect a figure.
Curated OER
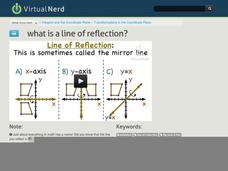
What is a Line of Reflection?
Line of reflection is basically a geometry term used in the transformation of figures. It identifies the line on the graph that you reflect a figure over. The line can be vertical, horizontal, and diagonal. Actually, it can be any line...


