Math Medics
S.o.s. Math: Trigonometric Functions
Introductory lesson to trigonometric functions. Includes definitions, properties, graphs, and a wide variety of examples and practice exercises.
Other
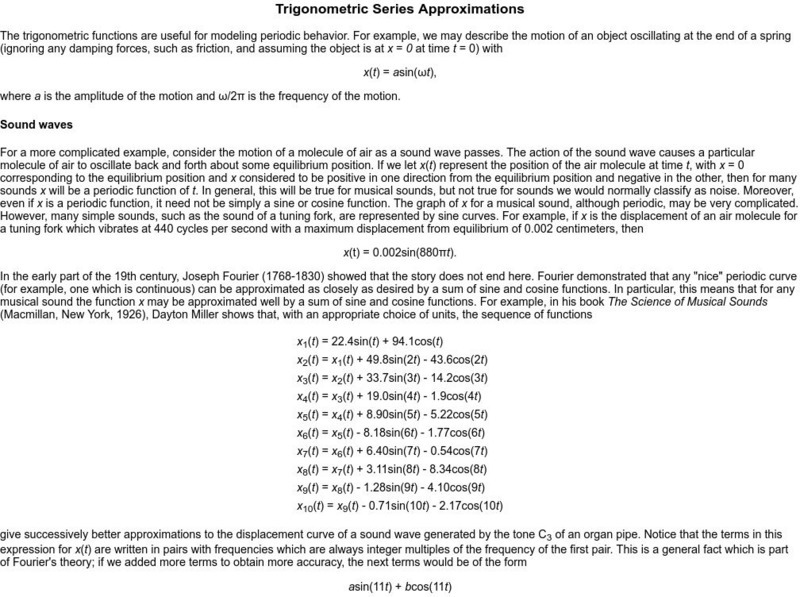
Dan Sloughter: Trigonometric Series Approximations
Understand how trigonometric functions can model periodic behavior. See the application of periodic behavior, amplitude, frequency in sound waves. Make sure to turn up your sound to load an audio file to play the given tone of the...
Math Graphs
Houghton Mifflin: Math Graphs: Fitting Models to Scatter Plots 1 [Pdf]
Students use a scatter plot to determine whether data can be modeled by a linear function, a quadratic function, a trigonometric function, or that there appears to be no relationship between x and y. The resource consists of an enlarged...
Math Graphs
Houghton Mifflin: Math Graphs: Fitting Models to Scatter Plots 2 [Pdf]
Students use a scatter plot to determine whether data can be modeled by a linear function, a quadratic function, a trigonometric function, or that there appears to be no relationship between x and y. The resource consists of an enlarged...
Math Graphs
Houghton Mifflin: Math Graphs: Fitting Models to Scatter Plots 3 [Pdf]
Students use a scatter plot to determine whether data can be modeled by a linear function, a quadratic function, a trigonometric function, or that there appears to be no relationship between x and y. The resource consists of an enlarged...
Math Graphs
Houghton Mifflin: Math Graphs: Fitting Models to Scatter Plots 4 [Pdf]
Learners use a scatter plot to determine whether data can be modeled by a linear function, a quadratic function, a trigonometric function, or that there appears to be no relationship between x and y. The resource consists of an enlarged...
Math Graphs
Houghton Mifflin: Math Graphs: Straightedge 1 [Pdf]
Students use a straightedge to approximate the value of each trigonometric function in the practice problem. The practice exercise is available in PDF format.
Math Graphs
Houghton Mifflin: Math Graphs: Straightedge 2 [Pdf]
Students use a straightedge to approximate the value of each trigonometric function in the practice problem. The practice exercise is available in PDF format.
Math Graphs
Houghton Mifflin: Math Graphs: Straightedge 3 [Pdf]
The practice problem asks students to use the given figure and a ruler to determine the value of trigonometric functions. The example is available in PDF format.
Math Graphs
Houghton Mifflin: Math Graphs: Straightedge 4 [Pdf]
The practice problem asks students to use the given figure and a ruler to determine the value of trigonometric functions. The example is available in PDF format.
Math Graphs
Houghton Mifflin: Math Graphs: Straightedge 5 [Pdf]
Learners use the given figure and a straightedge to approximate the values of each trigonometric function. The figure is available in PDF format.
Math Graphs
Houghton Mifflin: Math Graphs: Straightedge 6 [Pdf]
Learners use the given figure and a straightedge to approximate the values of each trigonometric function. The figure is available in PDF format.
Math Graphs
Houghton Mifflin: Math Graphs: Straightedge 7 [Pdf]
The practice problem uses a straightedge and a figure to approximate the solution of each equation. The figure is available in PDF format.
Math Graphs
Houghton Mifflin: Math Graphs: Straightedge 8 [Pdf]
The practice problem uses a straightedge and a figure to approximate the solution of each equation. The figure is available in PDF format.
Math Graphs
Houghton Mifflin: Math Graphs: Fitting Models to Scatter Plots 5 [Pdf]
Students evaluate a scatter plot to determine the relationship between two variables. The scatter plot is available in PDF format.
Math Graphs
Houghton Mifflin: Math Graphs: Fitting Models to Scatter Plots 6 [Pdf]
Students evaluate a scatter plot to determine the relationship between two variables. The scatter plot is available in PDF format.
Math Graphs
Houghton Mifflin: Math Graphs: Fitting Models to Scatter Plots 7 [Pdf]
Learners use a given scatter plot to identify whether the data can be modeled by a linear, quadratic, or trigonometric function. The math graph is available in PDF format.
Math Graphs
Houghton Mifflin: Math Graphs: Fitting Models to Scatter Plots 8 [Pdf]
Learners use a scatter plot to identify whether the data can be modeled by a linear, quadratic, or trigonometric function. The math graph is available in PDF format.
Other
Summary of Trigonometric Identities
A complete list of the important identities from high school trigonometry, complete with a set of exercises.
Windstream
Ojk's Precalculus Study Page: Evaluating and Graphing Sine and Cosine
An introduction to graphing the sine and cosine functions by using the 30-60-90 and 45-45-90 right triangle values of the two functions as guides.
Walter Fendt
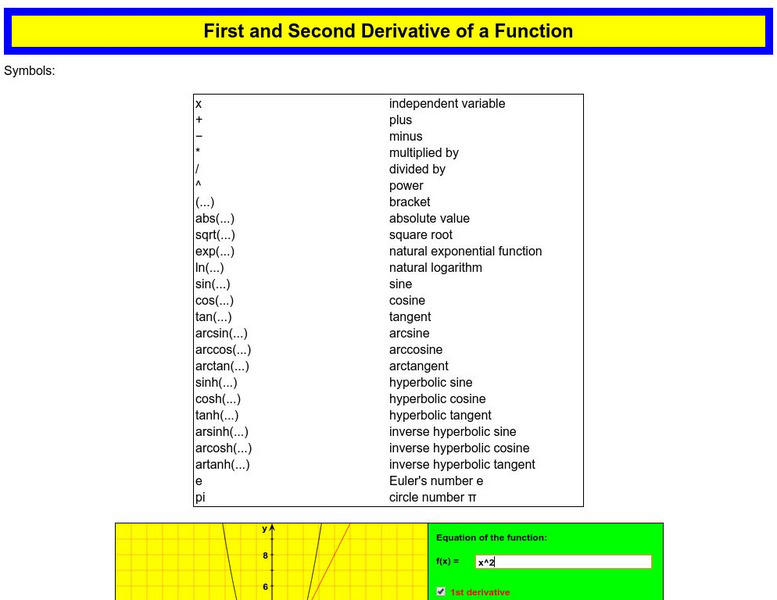
Walter Fendt: First and Second Derivative of a Function
A short interactive activity to visualize the first and second derivative of a function of your choice.
Interactive Mathematics
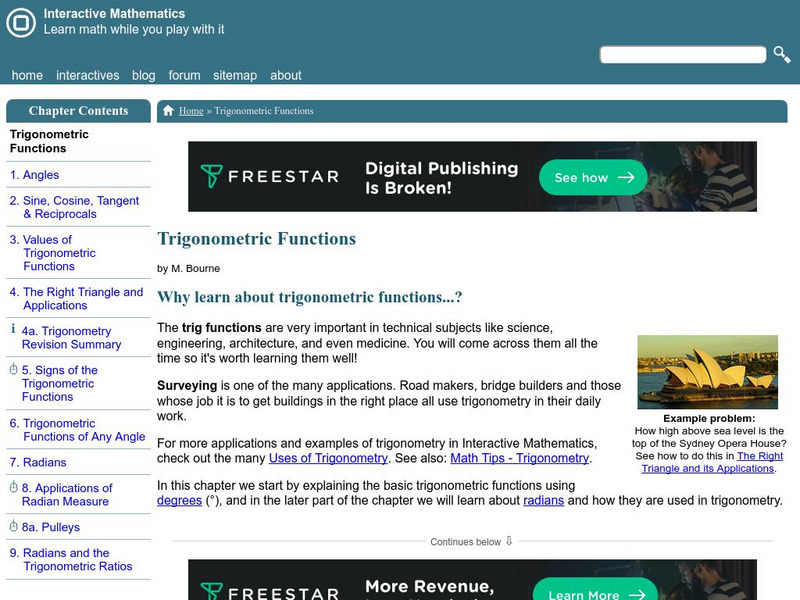
Interactive Mathematics: Trigonometric Functions
Just about everything you need to know about trigonometry can be found here. Interactive examples and demonstrations help to enhance the lessons. Although not required, the tutorial uses Live Math and Scientific Notebook.
Iowa State University
Inverse Trigonometric Functions
This trigonometry tutorial features an explanation of how the inverse of all six of the trigonometric functions are obtained--and includes a Java applet for further reinforcement of the concept.
Calculator Soup
Calculator Soup: Trigonometric Function Graphs F(x)
Images of trigonometric function graphs.


![Houghton Mifflin: Math Graphs: Fitting Models to Scatter Plots 1 [Pdf] Unknown Type Houghton Mifflin: Math Graphs: Fitting Models to Scatter Plots 1 [Pdf] Unknown Type](https://static.lp.lexp.cloud/images/attachment_defaults/resource/large/FPO-knovation.png)


