Hi, what do you want to do?
Curated Video
Comparing Range on Double Box Plots
In this video, the teacher explains how to find the difference in the range of data for two different stores using a double box plot. They define range as the difference between the minimum and maximum values in a dataset. This video...
Khan Academy
Khan Academy: Algebra: Box and Whisker Plot
Video demonstrates how to create a box-and-whisker plot from a set of data. [13:14]
Khan Academy
Khan Academy: Statistics: Box and Whisker Plots
Video demonstrating the creating of a box-and-whisker plot to analyze data. Includes link to practice problems. [10:05]
Varsity Tutors
Varsity Tutors: Hotmath: Graphing Calculator Practice Problems: Statistics
Practice using your graphing calculator for statistics problems, including displaying and interpreting data. If you get stumped or if you would like to check your work, then select the View Solution button, which is located directly...
Virtual Nerd
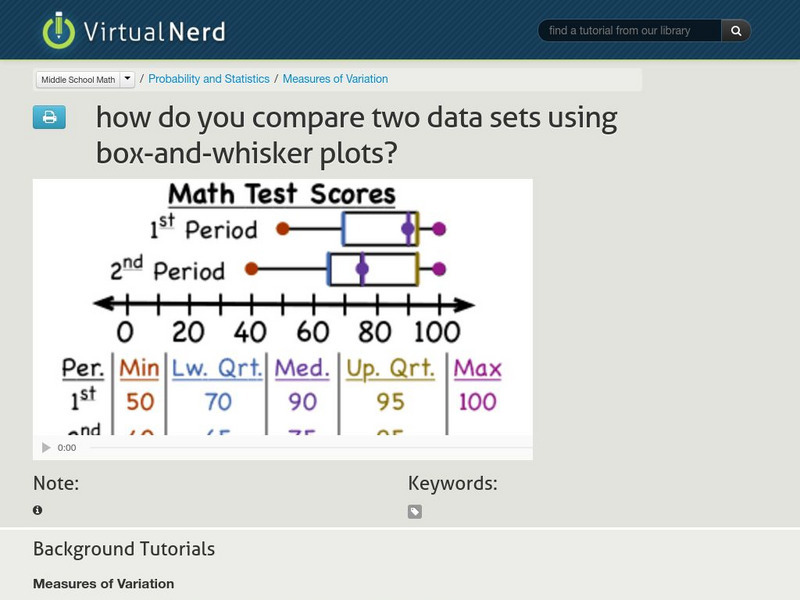
Virtual Nerd: How Do You Compare Two Data Sets Using Box and Whisker Plots?
How do you describe the similarities and differences between two data sets using box-and-whisker plots? This video gives you a great explanation using an example of test scores from two different math classes. [5:27]
Khan Academy
Khan Academy: Statistics: Reading Box and Whisker Plots
Video demonstration of reading a box-and-whisker plot to find the range, median and quartiles and to answer a question. [3:18]


