Texas Education Agency
Texas Gateway: Study Edge Statistics: Dot Plots and Comparing Distributions
Explains the features of dot plots, when they are used, and the statistical vocabulary that is used when describing them. Also models how to compare and contrast distributions. Includes downloadable study guide with exercises - guide...
Texas Education Agency
Texas Gateway: Study Edge Statistics: Comparing Distributions
This lesson discusses how to compare distributions of categorical data using different methods of display, e.g., bar charts, pie charts, and frequeny tables. Includes downloadable study guide with exercises - guide also covers other...
Sophia Learning
Sophia: Frequency Distributions and Histograms
Explore how to use frequency distribution to organize data and determine the difference between histograms and bar graphs.
Math Mammoth
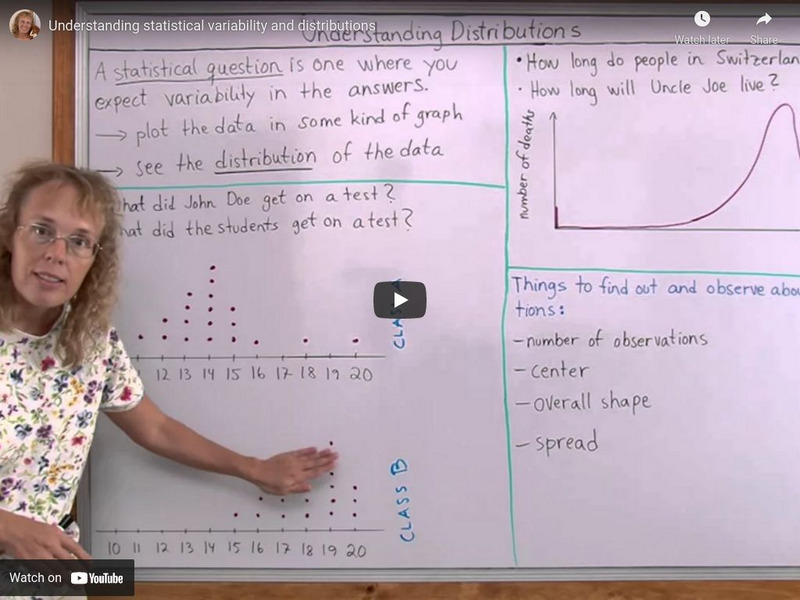
Math Mammoth: Understanding Statistical Variability and Distributions
This lesson explains what a statistical question is and how to describe the distribution of data by its center, spread, and shape. [7:08]
Crash Course
Crash Course Statistics #35: Fitting Models Is Like Tetris
Take a closer look at two common data models: ANCOVA (Analysis of Covariance) and RMA (Repeated Measures ANOVA).
Khan Academy
Khan Academy: Center, Spread, and Shape of Distributions Harder Example
The resource from Khan Academy provides practice questions for the SAT. Watch Sal work through a harder Center, spread, and shape of distributions problem.
Khan Academy
Khan Academy: Reading Line Graphs
A line graph is way to visually represent data, especially data that changes over time. Let's take a look at an example.
Sophia Learning
Sophia: Creating a Number Line for a Box Plot: Lesson 2
In this video lesson [3:35], students see how to construct the number line for a box plot. This is part of a series of lessons about construction of parts of a box plot. It is 2 of 9 in the series titled "Creating a Number Line for a Box...
Sophia Learning
Sophia: Creating a Number Line for a Box Plot: Lesson 5
In this video lesson [2:45], students see how to construct the number line for a box plot. This is part of a series of lessons about construction of parts of a box plot. It is 5 of 9 in the series titled "Creating a Number Line for a Box...
Sophia Learning
Sophia: Extreme and Mild Outliers
This lesson discusses how mild and extreme outliers are represented on a box plot.
Sophia Learning
Sophia: Extreme and Mild Outliers: Lesson 3
This lesson discusses how mild and extreme outliers are represented on a box plot. This is part of a series of lessons about the parts of a box plot. It is 3 of 3 in the series titled "Extreme and Mild Outliers."
Sophia Learning
Sophia: Finding Data on a Box Plot: Lesson 1
In this lesson, students see how to extract specific information from a box plot. Students should be able to read a box plot before beginning this lesson. It is 1 of 6 in the series titled "Finding Data on a Box Plot."
Sophia Learning
Sophia: Whiskers of a Box Plot: Lesson 5
This lesson discusses the whiskers of a box plot and what they represent about the data. This is part of a series of lessons about parts of a box plot. It is 5 of 5 in the series titled "Whiskers of a Box Plot."
Sophia Learning
Sophia: Creating a Number Line for a Box Plot
In this video lesson, students see how to construct the number line for a box plot. This is part of a series of lessons about construction of parts of a box plot.
Sophia Learning
Sophia: Creating a Number Line for a Box Plot
In this video lesson, students see how to construct the number line for a box plot. This is part of a series of lessons about construction of parts of a box plot.
Sophia Learning
Sophia: Whiskers of a Box Plot: Lesson 2
This lesson discusses the whiskers of a box plot and what they represent about the data. This is part of a series of lessons about parts of a box plot. It is 2 of 5 in the series titled "Whiskers of a Box Plot."


