Imagine Learning Classroom
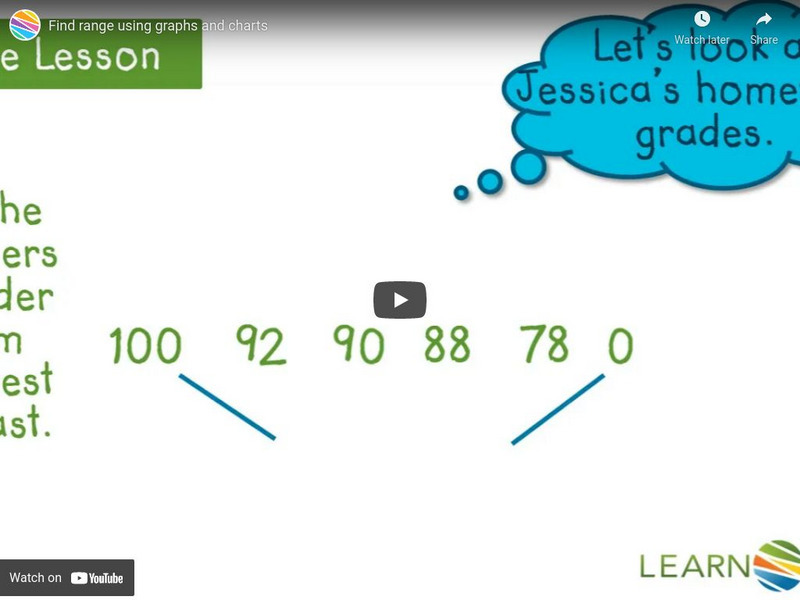
Learn Zillion: Find Range Using Graphs and Charts
In this lesson, you will learn to find the range of a given set of data including and excluding the outlier by using graphs and charts. Login gives access to a slideshow as well. [5:07]
Crash Course
Crash Course Statistics #4: Measures of Spread
This episode looks at measures of spread, or dispersion, which we use to understand how well medians and means represent the data, and how reliable our conclusions are. They can help understand test scores, income inequality, spot stock...

