Curated OER
How Many Televisions Do You Have in Your Home?-- Bar Graph
For this math worksheet, students participate in a group graphing activity. Students survey classmates as to how many televisions are in each home and plot the results on a bar graph.
Curated OER
Graphing a Survey
In this mathematical worksheet, students survey a selection of thirteen people to find out if they like to eat ice cream, cakes or pies and then fill in their graphs with the data they've collected.
Curated OER
Blank Bar Graph- Intervals of 3
In this bar graph worksheet, students use the blank bar graph grid to display data. The interval is counting by 3. There are no problems given.
Curated OER
Civic Engagement: Community and Social Action
Explain that today's project is that young scholars will get groups create a survey to poll their classmates on what they do to stay healthy. The results will then be shown on a bar graph.Students brainstorm ways of keeping healthy and...
Curated OER
'The Flood'
Students hear the story "The Flood," and take a survey of the favorite pet animals in the class. They take the information complied in the survey and make a bar graph to show favorite pet animals using the computer program KidPix.
Curated OER
Bar Graphs Using M & Ms
Fifth graders observe an overhead of a graph on which M & Ms have been poured out. A volunteer comes up and separates the colors writing on the overhead how many there were of each color and another person labels the graph's title....
Curated OER
Creating Bar Graphs
Fifth graders design and label a bar graph using data taken from a class survey. They observe a teacher-led lecture, write and conduct their survey, and create a bar graph that includes identification of the minimum, maximum, mode,...
Curated OER
Introduction to Bar Graphs Lesson Plan
Students organize and interpret data using bar graphs.
Curated OER
Creating Bar Graph
Seventh graders, after an explanation and demonstration compare how many different places there at Cocowalk.
Curated OER
Charting Weight
Sixth graders record the weight of themselves and 3 family over a week, and then use that data to compile 2 bar graphs and 4 line graphs and answer a series of questions.
Curated OER
Surveying During a Basketball Game
Tenth graders conduct a survey at a high school basketball game. They compile and present the data as histograms or bar graphs.
Curated OER
Creating Bar Graphs and Pie Graphs
Second graders observe a demonstration of the creation of a bar graph and a pie graph of their favorite colors. They gather information about various topics from their classmates, then organize the information, creating a bar and a pie...
Curated OER
High School Mathematics Problems from Alaska: Fire Fighting Crew
Students apply mean, median and mode calculations of firefighter test scores to decide on hiring.
Curated OER
ESTIMATION
Students practice estimating and counting and using a ruler to measure distance.
Curated OER
RAIN
Third graders accurately measure the amount of rain in the rain gauge on a given day and create a bar graph of the data collected.
Curated OER
Pictograph to Bar Graph
Second graders explore organizing data to make it useful for interpreting picture graphs and bar graphs. They use Graphers software to create a pictograph and a bar graph.
Curated OER
Groups Coming to America
Fifth graders use text or other references to locate different types of information about the Mayflower and pilgrims. They create a presentation for lower elementary classes about the Pilgrims.
Curated OER
M&M Graphing and Probability
Pupils create a variety of graphs. They count, sort, and classify M&M's by color and record data on a chart. They use data from the chart to create pictographs, bar graphs and circle graphs. They analyze data and determine probability.
Curated OER
Usage and Interpretation of Graphs
Students review graphing and use processing skills to solve problems.
Shodor Education Foundation
Shodor Interactivate: Lesson: Bar Graph
This instructional activity is designed to give students practice creating and reading bar graphs as well as understanding how to accurately represent a graph with appropriate units.
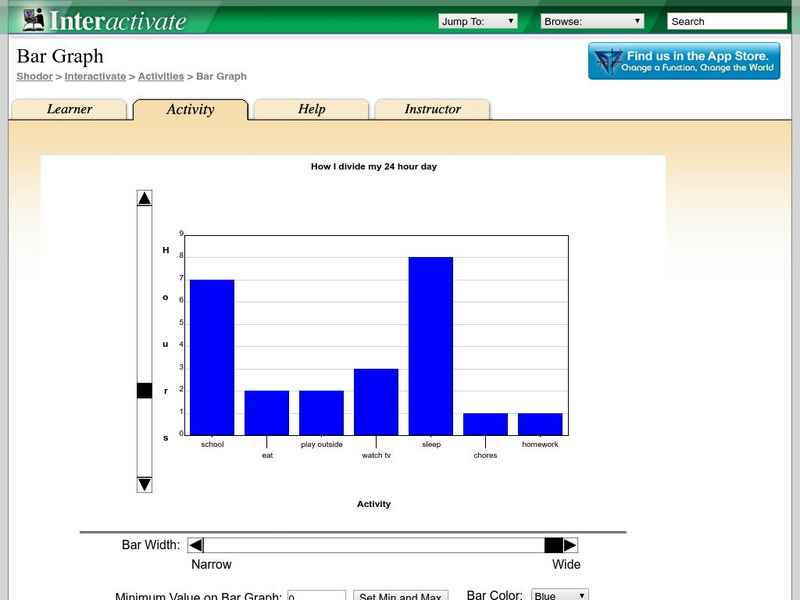
Shodor Education Foundation
Shodor Interactivate: Bar Graph
A wonderful tool and learning experience using a bar grapher. This site contains an interactive bar grapher and much more! Follow the "What?" link to get to classroom resources such as problems and explorations.
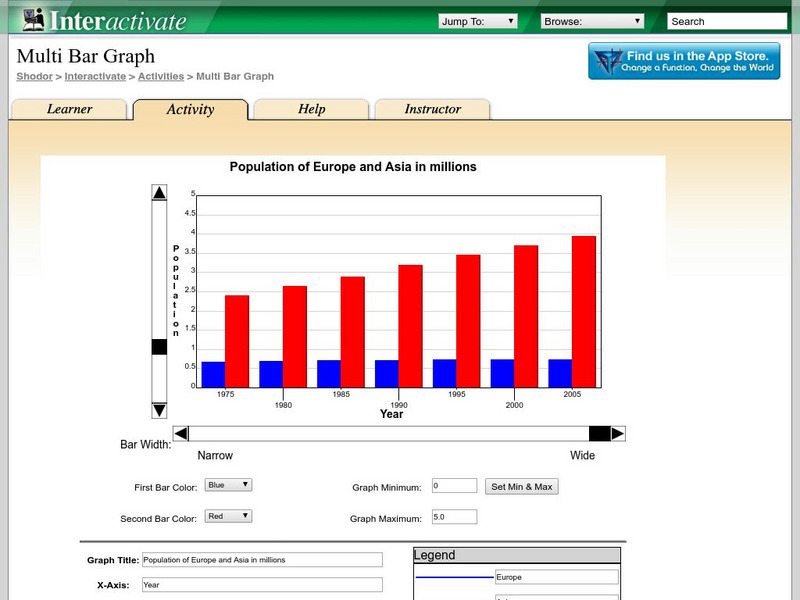
Shodor Education Foundation
Shodor Interactivate: Multi Bar Graph
The interactive learning activity allows students to manipulate a double bar graph. Teacher resources are included.
Science Buddies
Science Buddies: Interpreting Area Data From Maps vs. Graphs
Graphical methods of data presentation are a key feature of scientific communication. This project asks the question, "What's the best way to compare the land area of states: a map or a bar graph?" You'll be measuring performance on two...
University of Texas
Inside Mathematics: Our Pets [Pdf]
This task challenges a student to demonstrate understanding of concepts involved in representing and interpreting data.


![Inside Mathematics: Our Pets [Pdf] Lesson Plan Inside Mathematics: Our Pets [Pdf] Lesson Plan](https://static.lp.lexp.cloud/images/attachment_defaults/resource/large/FPO-knovation.png)