Cuemath
Cuemath: Data Handling
This comprehensive guide about data handling helps with understanding how the study of data handling and graphical representation of the data along with other tools help us in dealing with numerical data. Includes solved examples and...
Shodor Education Foundation
Shodor Interactivate: Misleading Graphs
This lesson will challenge students to think creatively by having them design and build water balloon catchers from random scrap materials, while requiring them to take into consideration a multitude of variables including cost,...
Louisiana Department of Education
Louisiana Doe: Louisiana Believes: Eureka Math Parent Guide: Collecting and Displaying Data
A guide to support parents as they work with their students in collecting and displaying data.
Louisiana Department of Education
Louisiana Doe: Louisiana Believes: Eureka Math Parent Guide: Problem Solving With Length, Money, and Data
A guide to support parents as they work with their students with problem solving with length, money, and data.
E-learning for Kids
E Learning for Kids: Math: Tea Store: Reading a Table
Students will demonstrate how to interpret information in a table.
E-learning for Kids
E Learning for Kids: Math: Pizza (Italian) Restaurant: Data and Chance
In this interactive site, students practice with bar and picture graphs by helping a pizza place collect and analyze their data.
E-learning for Kids
E Learning for Kids: Math: Tea Store: Data and Graphs
Play games by exploring how to interpret bar graphs and organize data in a table.
Other
Nearpod: Reading Picture & Bar Graphs
In this lesson on picture graphs and bar graphs, 2nd graders learn key vocabulary, draw the graphs, and compare the graphs.
E-learning for Kids
E Learning for Kids: Math: Traditional African Village: Bar Graph and Data
Help Kyan make a bar graph with the ages of the children in his village.
E-learning for Kids
E Learning for Kids: Math: Wizards: Graphs
Join the Magic Wandia Games and learn all about graphs!
E-learning for Kids
E Learning for Kids: Math: Orange Trees, Olive Trees: Graphs
Tomas and Luna are farmers. See how many oranges and olives they have collected!
E-learning for Kids
E Learning for Kids: Math: Treasure Island: Interpreting Data
Students will play interactive games to interpret information from different types of graphs.
National Council of Teachers of Mathematics
Nctm: Illuminations: Bar Grapher
A computer applet that will draw any bar graph with student's data input.
National Council of Teachers of Mathematics
The Math Forum: How to Make a Bar Graph
Site contains specific directions for making bar graphs using a Claris Works spreadsheet file.
Scholastic
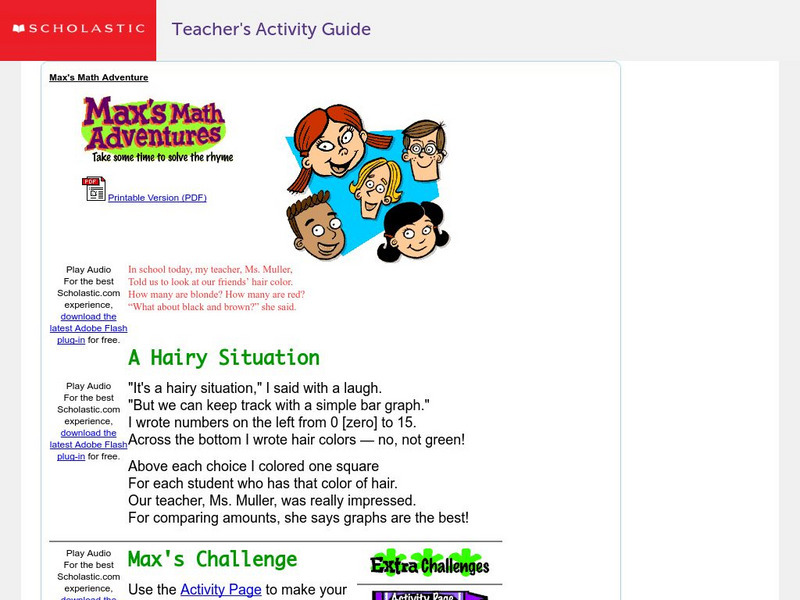
Scholastic: Max's Math Adventures: A Hairy Situation
Help Max make a bar graph to show the hair colors of his classmates. Teachers will appreciate the activities with bar graphs in the extra challenges. Use the teacher's guide to create a fun and engaging lesson.
Math Slice
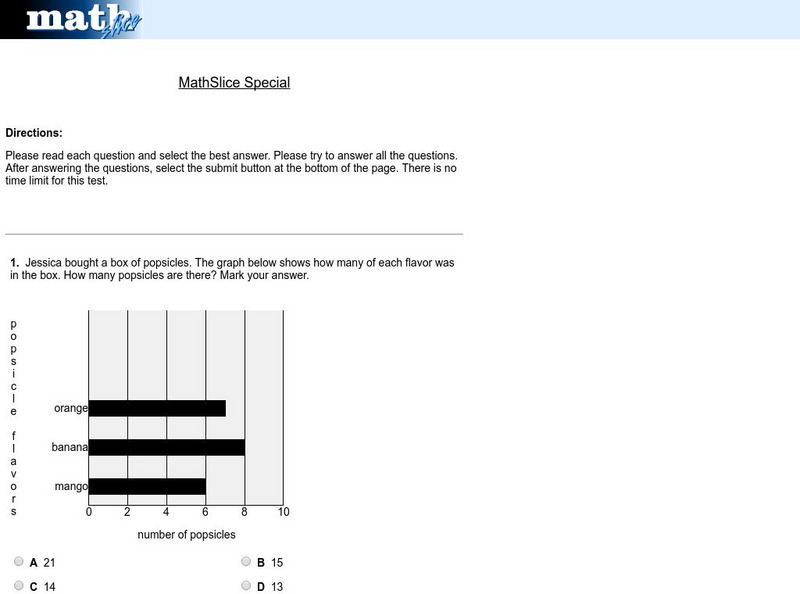
Math Slice: Chart Slice Special Test
A ten question test assessing data collection and analysis skills with bar graphs. Assessment is scored online. An excellent tool for assessment.
The Math League
The Math League: Using Data and Statistics: Pie Charts
This introductory tutorial about statistical graphing with four examples of how pie charts (circle graphs) are constructed and read.
Sophia Learning
Sophia: Using Graphs to Analyze Data
This lesson will demonstrate how to analyze and interpret data given in the form of a graph.
ClassFlow
Class Flow: Thanksgiving Graphing
[Free Registration/Login Required] Students will interpret data from a bar graph and a pictograph. They will then create one of each on the Activboard. This flipchart includes links to websites and an Activote quiz.
ClassFlow
Class Flow: Ice Cream Bar Graph
[Free Registration/Login Required] This flipchart reviews bar graphs, how to create them and read them. Excellent activity to get your students involved in a tasty math activity!
Varsity Tutors
Varsity Tutors: Hotmath: Algebra Review: Bar Graph
Find a quick, concise explanation of a bar graph. An example is given.
ClassFlow
Class Flow: Witches Brew
[Free Registration/Login Required] This flipchart concentrates on subtraction but uses a wide variety of teaching strategies to help students understand subtraction. The clever theme keeps their attention and problems are stated in...
ClassFlow
Class Flow: Zoo Addition
[Free Registration/Login Required] This flipchart concentrates on addition but uses a wide variety of teaching strategies to help students understand addition. The clever theme keeps their attention and problems are stated in several...
ClassFlow
Class Flow: Charts Handling Data
[Free Registration/Login Required] Reading graphs fit together with this engaging, colorful flipchart analyzing pie charts, bar graph, percents, and fractions.


