Curated Video
How to Interpret Circle Graphs
In this short video we will answer a standardized math test question where we are asked to interpret circle graphs to answer an open response math test question. We will understand that a circle graph represents 100% and is divided or...
Curated Video
Preparing for Grade 6 Math State Assessment
This video prepares Grade 6 students in Massachusetts for their state assessment by reviewing Common Core math standards. It includes practice questions and emphasizes the importance of showing work, while also covering topics such as...
Visual Learning Systems
Observations and Data: Types of Graphs
One of the most important processes in science is the art of observing. This video highlights different ways observations are made, emphasizing methods by which students can observe their world. Different types of data, how data is...
Virtual Nerd
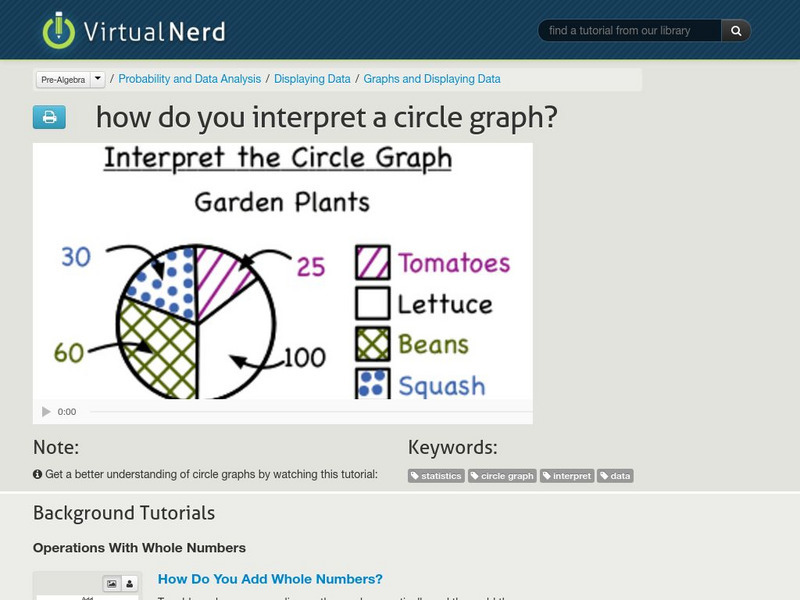
Virtual Nerd: How Do You Interpret a Circle Graph?
A circle graph can be an easy way to visualize data. Watch this video to learn more about circle graphs. [3:59]
Virtual Nerd
Virtual Nerd: How Do You Use a Circle Graph to Make Predictions?
Circle graphs can help predict the future. Watch and learn how this is possible! [4:57]
Virtual Nerd
Virtual Nerd: How Do You Interpret a Circle Graph?
Gain an understanding of circle graphs by watching this tutorial. [3:59]
Virtual Nerd
Virtual Nerd: How Do You Use a Circle Graph to Make Predictions?
Learn how to predict using a circle graph by watching this video tutorial. [4:58]
Khan Academy
Khan Academy: Statistics: Reading Pie Graphs (Circle Graphs)
Video demonstration of reading pie graphs/circle graphs to answer questions. [3:09]
Sophia Learning
Sophia: Exploded Pie Charts: Lesson 5
This lesson introduces the exploded pie chart as another way of presenting data. It is 5 of 5 in the series titled "Exploded Pie Charts."


