Bozeman Science
AP Biology Practice 5 - Analyze Data and Evaluate Evidence
In this video Paul Andersen explains how scientists analyze data and evaluate evidence. He starts with a description of data and how it must be properly displayed. He then describes types of data in each of the four big ideas. He finally...
Curated Video
Design Microservices Architecture with Patterns and Principles - Event Hubs and Event Streaming in Event-Driven Microservices Architecture
This video provides an in-depth understanding of event hubs and event streaming technologies in the context of event-driven microservices and explores the features, capabilities, and use cases of event hubs and discusses how they enable...
Curated Video
Data Science and Machine Learning with R - Data Manipulation Section Introduction
This video introduces you to data manipulation. This clip is from the chapter "Data Manipulation in R" of the series "Data Science and Machine Learning with R from A-Z Course [Updated for 2021]".This section focuses on data manipulation...
Healthcare Triage
From DNA to Diagnosis: Healthcare Triage Podcast
Aaron talks to Dr. Tatiana Foroud about her career and her current work in genetics and genomics. Her work spans from the early days of searching for DNA markers for rare disorders to today's search for genetic causes and potential...
Loyola University Chicago
Math Flix: Graphs: Scatter Plot Decoding
This QuickTime movie provides an opportunity to create a data table by analyzing a scatter plot. As you watch and listen to the teacher and student interact it helps clarify the thinking behind applying this concept.
Crash Course
Crash Course Sociology #4: Sociology Research Methods
This video focuses on sociology research methods. Today we're talking about how we actually DO sociology. Nicole explains the research method: form a question and a hypothesis, collect data, and analyze that data to contribute to our...
Sophia Learning
Sophia: Finding the Mean of a Set of Data
This video lesson demonstrates how to calculate the mean for a set of data. Students can check their understanding with an assessment.
Sophia Learning
Sophia: Finding the Mean of a Set of Data
This video lesson demonstrates how to find the mean of a data set. It includes detailed examples about when it is appropriate to find the mean.
Sophia Learning
Sophia: Histogram Tutorial
Determine when to use and how to display data using a histogram.
Sophia Learning
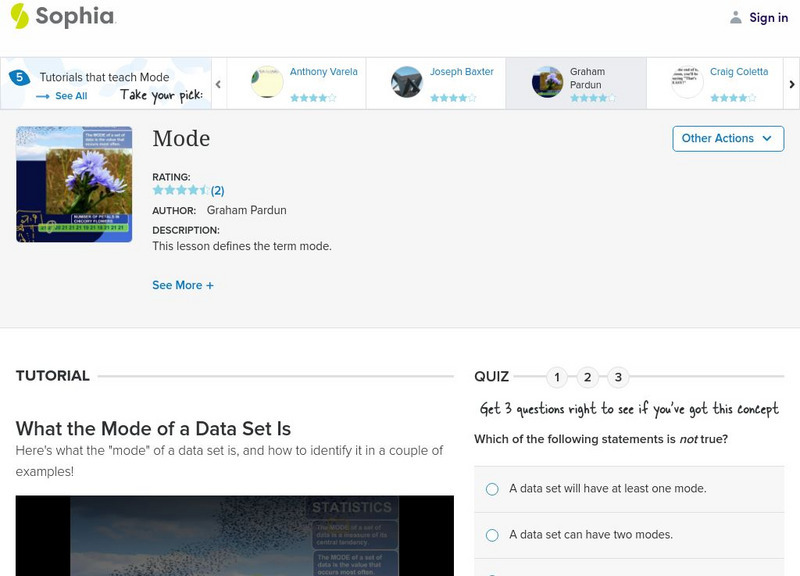
Sophia: Mode
This video lesson defines and provides examples of mode for a data set. Students can check their understanding with an assessment.
Khan Academy
Khan Academy: Box and Whisker Plots: Constructing a Box and Whisker Plot
Constructing a box and whisker plot to analyze data.
Sophia Learning
Sophia: Box and Whisker Plot
This video lesson introduces and provides an example of a box-and-whisker plot. Students can check their understanding with an assessment.
PBS
Pbs Learning Media: Fantasy Baseball
Explore the game of baseball, then use what you've learned to use decimals and ratios to analyze key statistical data, draft players and make trades, based on an analysis of the data.
Loyola University Chicago
Math Flix: Graphs: Matching Stories to Graphs Part 2
This QuickTime movie provides more opportunities to match stories to graphs. As you watch and listen to the teacher and student interact it helps clarify the thinking behind applying this concept.
Loyola University Chicago
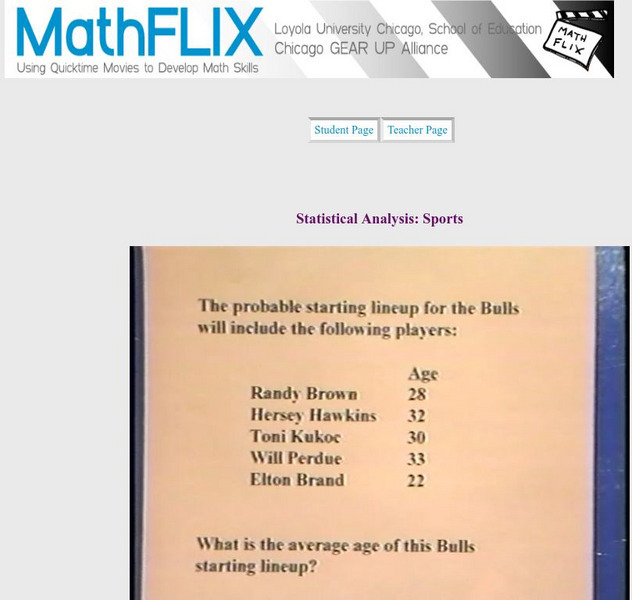
Math Flix: Statistical Analysis: Sports
This QuickTime movie discusses ways to analyze sports statistics. As you watch and listen to the teacher and student interact it helps clarify the thinking behind applying this concept.


