Radford University
Is Fall Normal?
Fine the normality of fall measurements. Pairs collect measurements of fall leaves and one other fall object. Using the measurements, the groups determine the descriptive statistics for the object and using the Empirical Rule, figure out...
Radford University
Is it Really a Small World After All?
Working in groups, learners research four countries' populations over the past 30 years. Using the data collected, the teams find regression equations that best fit the data. Taking the regression equations, they then make predictions...
Radford University
How to Calculate and Analyze the Equation for a Parabolic Path
Working in groups, pupils plot three points on the coordinate plane representing three different parabolic paths. Using a calculator, they determine the quadratic regression equation for their models. Each team then figures out the...
Radford University
Skate Ramp
Going up and down makes a more exciting ride. Pupils recall what they know about continuity and limits of functions. Working in groups, classmates design a skateboard ramp that meets a given set of criteria, using at least three...
Radford University
Animal Decline
Where did they all go? Small groups collect data on different animal species that are on a decline. Teams develop equations to model the populations over time and then create presentations about the decline of their animals. Classmates...
Radford University
Discovering Quadratics
Get to know quadratics from a couple of different perspectives. Classmates work in small groups to determine the optimal cooking time for microwave popcorn. Group members pop bags of popcorn for different times and collect data on the...
Radford University
Population Project
How fast does it grow? Scholars work on two tasks dealing with exponential growth, one on population growth and the second on investments. Learners research a country's population over the past century and make predictions of the current...
Radford University
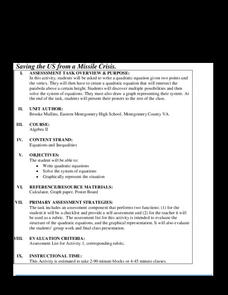
Saving the US from a Missile Crisis
Mathematically shoot down an incoming missile. Given information about the Cuban Missile Crises, learners calculate the equation of the trajectory of an imaginary missile launched from Cuba toward Washington, D.C. Scholars determine the...
Radford University
Modeling Quadratics Basketball Video Project
Will he make it? After watching a video of part of a basketball shot, groups create their own videos. Teams record a video of shooting a ball at a hoop and edit it to show only a portion of the shot. Group members determine the equation...
Radford University
Connecting Scatter Plots and Correlation Coefficients Activity
Collect a variety of bivariate data. Groups determine sets of data that would provide a positive, negative, and no correlation. Team members gather their data through out the week. Scholars plot the data and determine the relationship...
Radford University
Snappy Stair Sprints
Let's go for a run. Small groups determine a way to collect data to determine the time it would take to run a set of stairs. After creating a plan, teams collect data and graph their results, calculating the equation of best fit and...
Radford University
At the Gas Pump
Given the price of crude oil, gasoline, and diesel for the past several years, pupils plot the data to determine whether a correlation exists. Learners determine a regression line and predict the price of gasoline and diesel in the...
Radford University
Box-and-Whisker Activity
Think inside the box. Working in small groups, pupils design a study to answer comparing two data sets. Team members collect data and construct box-and-whisker plots and analyze them to prove or disprove their hypothesis. They develop...
Radford University
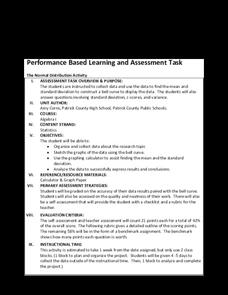
The Normal Distribution Activity
For whom does the bell fit? Pupils begin by working in groups gather data on three different variables. They then determine the mean and standard deviation of each data set and create bell curves. To finish, they answer guiding questions...
Radford University
Are We Normal?
Develop a sense of normal. Learners develop two questions to ask classmates to gather numerical data before creating a box and whisker plot and a histogram to display their data. Class members make inferences and investigate the data...
Radford University
I Want to Rock!
Find the best deal on music. Small groups create playlists of music and determine the cost based on different pricing structures. They determine whether the pricing structure represents a direct or inverse variation relationship by...
Radford University
Tuition Cost Activity
Can I afford to go to college? Small groups design a method to research college tuition for several years and make a prediction of costs in 2025. Classmates plot the the data on a scatter plot and graph the line of best fit to make their...
Radford University
Can I Create a Line/Curve of Best Fit to Model Water Drainage?
Learners collect data on the amount of water left in a bottle over time. They graph the data to determine whether the scatter plot shows a curved or straight relationship. Group members then determine an equation for the curve of best...
Radford University
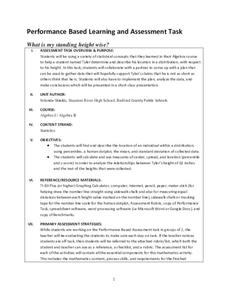
What is My Standing Height Wise?
Given a scenario in which a class member wants to prove his height is not an outlier, pairs devise a plan and gather evidence to help support his claim. The small groups implement their plans and create graphical displays of their data...
Radford University
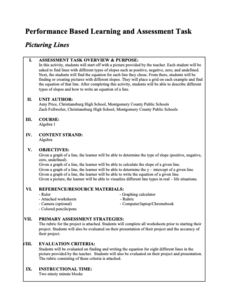
Picturing Lines
Slopes are everywhere—even in houses! Given a picture of a house, learners find lines with positive, negative, zero, and no slopes. Scholars determine the equation of the lines by calculating the slopes and y-intercepts. Class members...
Radford University
Pizza, Pizza!
Ponder the problem of pizza prices. Pupils use provided information about two different pricing schedules for pizza. They create tables of values and functions to represent the pricing schemes, consider domain restrictions, and identify...
Radford University
Regression Analysis Activity
Don't let your knowledge of regression analysis regress. Pupils take part in three activities to learn about regression curves. They research and collect data to predict how long it will take a basketball to hit the ground, find a...
Radford University
Green Cravings
Build up a bag of green. Pupils determine the number of green Skittles in a snack bag and come up with a way to determine how many snack bags it would take to create one bag of only green Skittles. Classmates share their methods and...
Radford University
Surface Area of Boxes
Explore surface area out of the box. Pairs investigate surface area by measuring two boxes and calculating the area of each side. Classmates trace one of the boxes onto butcher paper and create a net with the same area. Groups then...


