Bowland
Alien Invasion
Win the war of the worlds! Scholars solve a variety of problems related to an alien invasion. They determine where spaceships have landed on a coordinate map, devise a plan to avoid the aliens, observe the aliens, and break a code to...
New York State Education Department
TASC Transition Curriculum: Workshop 11
You'll C-E-R a difference in classroom achievement after using a helpful lesson plan. Designed for economics, civics, government, and US history classes, participants practice using the CER model to craft arguments about primary and...
Curated OER
Colonial Vacation Planner
Looking for a good lesson on the Colonial Period for your upper-elementary class? Then, this lesson is for you! They use website designs, U.S. travel publications, and maps to plan a family vacation to states which were part of the...
Curated OER
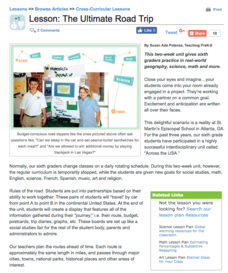
The Ultimate Road Trip
Sixth graders experience and practice real-world geography, science and math as they imagine planning out the ultimate road trip. They set goals and maintain a daily budget as they are given a set of rules as they plan their road trip...
Curated OER
Petroglyphs and Pictographs
Fourth graders make necklaces out of petroglyphs that they stamp into clay. In this petroglyphs lesson plan, 4th graders draw designs and explain where they come from as well.
Curated OER
Surface Area and Measuring
Tenth graders explore volume and surface area through percentages. In this geometry lesson plan, 10th graders analyze the surface area of two and three dimensional shapes, then use percents and ratio to compare the two.
Curated OER
Utah's Harvest
Fourth graders recognize the importance of the physical geography on a community. In this commodities lesson, 4th graders graph the five most important commodities of Utah. Students understand why these commodities are so...
Curated OER
Analyzing the Job Market for Babysitting in Your Neighborhood
Young scholars conduct research on a neighborhood in Canada. In this data analysis lesson, students use data from the 2006 Canadian census to draw conclusions about a population group.
Curated OER
Tourism in London
Students discuss the tourist attractions that are in London. They examine how data can be manipulated by completing a worksheet. They plan a trip to a London attraction after conducting Internet research.
Curated OER
Jr. Chef Club
Students examine the food pyramid. In this health/math lesson students make biscuits. Students are assigned a group to measure out ingredients. Students also discuss which part of the food pyramid biscuits fall into and the nutritional...
Curated OER
Plotting the Ocean Floor
Fourth graders plot points on a graph, connect the dots to make the ocean floor profile and label the topographical features. They utilize a worksheet and a website imbedded in this plan to plot the ocean floor.
Curated OER
How does Your Province Stack Up?
Learners investigate data about age, and sex of a population. For this statistics lesson, students are given data on a population to analyze and compare to other provinces. This assignment is part of a geography lesson and requires 3...
Curated OER
The Great Race: From Anchorage to Nome
Students study the history of the Iditarod sled dog race. They research facts related to biology, sled dogs, and geography in order to put that history in perspective.
Curated OER
Youth vs. Adult Employment
Learners investigate the unemployment rate in Canada. In this statistics lesson plan, students collect data on youth finding jobs, graph and analyze the data. This assignment raises awareness of the employment problems in Canada.
Curated OER
More Physical Education in 2002 #152
Challenge your class with this problem-solving experience. Learners design a way to add more periods of physical education in the school week without building more gyms. Then, fifth and sixth graders make a list of ideas and choose one....
Curated OER
Water in the Texas Coastal Basins
Students, after researching a Texas coastal basin, map and graph the information they collect and then translate it into a short report to be presented to their classmates. They brainstorm unique ways to maintain Texas estuaries as well...
Curated OER
Statistics Canada
Students practice using graphing tools to make tables, bar charts, scatter graphs, and histograms, using census data. They apply the concept of measures of central tendency, examine the effects of outliers. They also write inferences and...
Curated OER
NIGHT AND DAY: DAILY CYCLES IN SOLAR RADIATION
Students examine how Earth's rotation causes daily cycles in solar energy using a microset of satellite data to investigate the Earth's daily radiation budget and locating map locations using latitude and longitude coordinates.
Curated OER
Water: On the Surface and in the Ground
Pupils explore the differences between surface water and ground water. They collect data using maps and graphs and investigate a Texas river basin and a nearby aquifer. They complete a written report including maps and data regarding the...
Curated OER
Nazi Concentration Camps -- Map and Chart-Reading Activities
Students use an informational chart about Nazi concentration and death camps to complete a mapping activity and a chart-reading activity.
Curated OER
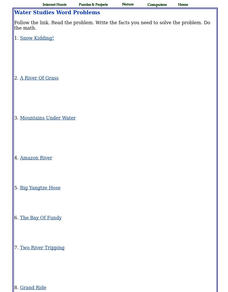
Water Studies Word Problems
In this water learning exercise, students read mini articles and solve math word problems having to do with water. Students complete 16 word problems.
Curated OER
Neighborhood statistics
Learners examine statistics relating to neighborhoods. They use the data to explain how a population affects their environment. They discuss how businesses use statistics to find out information about their clientele.


