Shodor Education Foundation
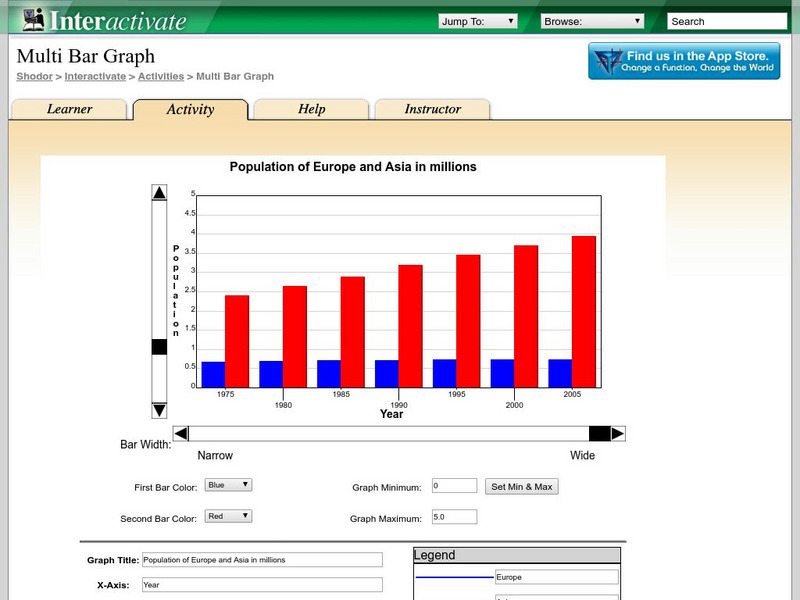
Shodor Interactivate: Multi Bar Graph
The interactive learning activity allows students to manipulate a double bar graph. Teacher resources are included.
National Council of Teachers of Mathematics
Nctm: Illuminations: State Names
Students use multiple representations to display how many times the letters of the alphabet is used in a state name. Concepts explored: stem and leaf, box and whisker plots, histograms.
Khan Academy
Khan Academy: Can Tickling Help Us Understand Some Symptoms of Schizophrenia?
Can tickling help us understand some symptoms of schizophrenia? Read about a study that was conducted on this topic and answer questions based on the given bar graph.
PBS
Pbs: The Lowdown: Living Wages in Ca: Ratio and Rate in the Real World
In this KQED infographic, find out how much an adult in different-sized households needs to make to pay for basic monthly living expenses. In the accompanying classroom activity, students solve real-life problems involving rate and ratio...
Better Lesson
Better Lesson: Say It With Stats! Review
The students will be working in centers to review for their test. The centers will consist of a computer rotation, versa-tiles, and a teacher center. All centers will reinforce concepts learned throughout this unit to prepare them for...
Purple Math
Purplemath: Stem and Leaf Plots
Explains how to create a stem-and-leaf plot from a data set. Demonstrates how to format a clear stem-and-leaf plot.
Other popular searches
- Skittles Bar Graph
- Double Bar Graphs
- Bar Graphs Pictographs
- Histogram and Bar Graph
- Bar Graphs and Histograms
- Bar Graph Problem Solving
- Favorite Food Bar Graph
- Bar Graphs Histograms
- Interpreting Bar Graphs
- Bar Graphs for Birthdays
- Bar Graph Worksheet
- Bar Graphs and Charts


