Curated OER
Water: From Neglect to Respect
The goal of this collection of lessons is to make middle schoolers more aware of the ways in which they are dependent upon water to maintain their standard of living. Learners compare water use in Lesotho to water use in the United...
Curated OER
Line 'Em Up!
Students find coordinate points on a grid and create a line graph with those points. This lesson should ideally be used during a unit on various types of graphs. They make and use coordinate systems to specify locations and to describe...
Curated OER
Stick Out Your Tongue
Students explore their sense of taste and recognize good foods to eat. In this tasting lesson, students recognize that their tongue has taste buds for different types of tastes. Students create a bar graph showing their favorite taste (...
Curated OER
Wolves
Students explore wolves. In this ecology and wolves lesson, students research predator-prey relationships on the Internet and complete a related worksheet with a partner. Students interpret data on bar graphs to determine growth and...
Curated OER
Spicy, Hot Colors
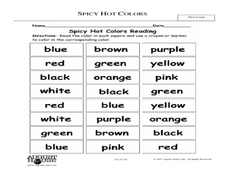
Students demonstrate an understanding of colors. In this visual arts lesson, students read the text Hot, Spicy Colors and name their favorite colors. Students complete a bar graph to show the data. Students discuss how each color can...
Curated OER
Meet The Graphs
Students identify two types of graphs. They analyze and interpret authentic data shown in bar and pie graphs and complete a graph given specific data. Perform simple functions within an Excel document:
K12 Reader
Displaying Data
It's important to learn how to display data to make the information easier for people to understand. A reading activity prompts kids to use context clues to answer five comprehension questions after reading several paragraphs about...
Curated OER
A Closer look at Oil and Energy Consumption
Upper graders analyze basic concepts about the consumption, importation and exportation of the worlds oil production. They create several graphs to organize the data and draw conclusions about the overall use of oil in the world.
Curated OER
Language Arts: Lewin Project
Fourth graders read and respond to the poem, "When I Am Angry." They complete surveys by analyzing the most common feeling and draw a bar graph of their behavior, using different colors to identify the duration of various feelings. ...
Curated OER
Force and Gliders
Students explore physics by creating data graphs in class. For this flight properties lesson, students read the book Flying Machine and identify the force, resistance and construction necessary to keep a glider in the air. Students...
Curated OER
A Birthday Basket for Tia
Students practice reading and math skills using technology. In this main idea lesson, students retell the important events of A Birthday for Tia in sequence using Kid Pix. Students create a bar graph using The Graph Club and use...
Curated OER
Body Measuring Activity
Students explore geometry by participating in a measurement activity. In this human anatomy lesson, students identify the appropriate methods to measure human body parts and do so in class. Students create a bar graph from their class...
Curated OER
The Haar Wavelet Filter Bank
In this Haar Wavelet worksheet, students solve and complete 4 different problems related to the Haar Wavelet filter bank. First, they define the properties of Haar basis. Then, students compute the matrices for the first, second and...
Curated OER
A is for Apple
Learners participate in a variety of activities to learn about apples. Students graph apples, learn about apple uses, taste apples, and observe what happens when apples are dipped in lemon juice.
Curated OER
By Golly, By Gum
Learners investigate the ingredients and creation of chewing gum. In this scientific method lesson, students make predictions about what will happen to the mass of a piece of gum as it is chewed by a human. Learners graph the data from...
Curated OER
Enhancing Writing Through Technology
Students participate in a class survey of their favorite activity to do in the snow and organize the results in a graph. They write a paragraph about the graph using language from a class-developed word web and include both an opening...
PreKinders
Transportation Word Cards
Beep beep! Zoom! Honk honk! Explore the world of transportation with a set of transportation picture word cards. Fifteen cards show trucks, planes, trains, boats, and many more types of transportation, complete with pictures and names.
ESL Kid Stuff
Clothes
How would your kids react if they saw a big pile of clothes in the middle of their classroom? Learn about different types of clothes with a lesson that includes songs, games, and a fun dress-up activity.
Curated OER
The Guise of a Graph Gumshoe
Eighth graders practice constructing bar, circle, and box-and-whisker graphs. They practice reading and interpreting data displays and explore how different displays of data can lead to different interpretations.
Curated OER
The Meatrix: Do You Want the Truth? Factory Farm vs. Family Farm
Students examine the differences between family farms and factory farms. They practice using different math computations and reading graphs and tables. They work together in groups to research the differences between the farms and make a...
Curated OER
Athletics Datafile
In this computer worksheet, students load and open a copy of ViewPoint and Olympics. They explore the data by identifying how many men and women are contained in the file and which country has the most files. Then they plot a bar graph...
Curated OER
Favorite Survey
Fourth graders collect and organize data for charts and bar graphs by questioning their classmates. They utilize a worksheet imbedded in this plan which guides them through their 'favorites' survey.
Curated OER
Recycling Bottles
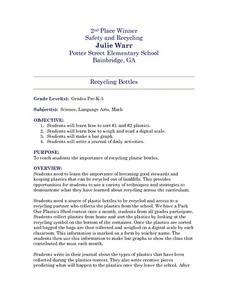
Students learn how to sort #1 and #2 plastics and how to weigh and read a digital scale. The bags are then collected and weighed on a digital scale and the information is used to make bar graphs. They also write in their journal about...
Curated OER
Recording Frequency
First graders analyze nursery rhymes and gather data about word frequency. In this frequency lesson, 1st graders create graphs and tables. Students interpret the data.
Other popular searches
- Skittles Bar Graph
- Double Bar Graphs
- Bar Graphs Pictographs
- Histogram and Bar Graph
- Bar Graphs and Histograms
- Bar Graph Problem Solving
- Favorite Food Bar Graph
- Bar Graphs Histograms
- Interpreting Bar Graphs
- Bar Graphs for Birthdays
- Bar Graph Worksheet
- Bar Graphs and Charts


