Curated OER
Bar Graphs and Pie Charts
Fourth graders explore their interest and strengths and display them using a bar graph and pie chart.
Curated OER
If You Were a Community Helper for a Day, Which One Would You Like To Be?-- Class Bar Graph
In this math worksheet, students collaborate to make a class bar graph. Students choose from a list of 12 occupations they are interested in and plot the information on the graph.
Curated OER
What Does Your Bean Seed Look Like Today?-- Class Bar Graph
In this math/science worksheet, students who are already beginning to grow a bean seed record what it looks like on a given day. Detailed pictures of different growth stages are provided on the class graph.
Curated OER
Color Graphs and Poetry
Students explore color as they create graphs, write poetry, and examine varied interior designs. They respond to writing prompts describing their favorite color. Students collect data and create a bar graph based on a class survey. They...
Yummy Math
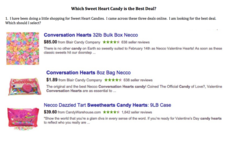
Which Sweet Heart Candy Is the Best Deal?
Get the most Valentine's candy for your money with a fun math activity! After examining three deals for buying candy hearts in bulk, young mathematicians decide which deal is the best and use bar graphs to demonstrate their claim. They...
Curated OER
BUS: Farming: It's A Fact (Ag)
Learners create two different types of graphs from the information in the "Farm Facts" booklet (i.e., bar graph, pie chart, etc.). They calculate where your food dollars are spent (on and off farm).
Curated OER
How Many Days Did It Take for Your Bean Seed To Germinate?--class Bar Graph
For this math/science worksheet, students collaborate as a class to create a bar graph which displays the germination time for bean seeds. Students survey their classmates and plot results on a graph.
Curated OER
Effects of chemical use in Agriculture
Students research environmental data to create a bar graph. In this agricultural ecology lesson, students research the pros and cons of chemical use in farming. Students debate on passing a law to reduce chemical use.
Curated OER
The Top Ten On-The-Job Skills and Attitudes
Learners interview people who have a business and have people working for them. They create a bar graph with the results of their survey. They create a chart with the most important skills or attitudes looked for in a potential employee.
Radford University
Marketing Mayhem: Advertising for Adolescents
You'll be sold on using the resource. Future consumers first conduct a sample survey on marketing strategies. They then consider how mass media influences their age groups and create presentations to display their findings.
Curated OER
The Meatrix: Do You Want the Truth? Factory Farm vs. Family Farm
Students examine the differences between family farms and factory farms. They practice using different math computations and reading graphs and tables. They work together in groups to research the differences between the farms and make a...
Curated OER
Apples and Apple Activities
Students investigate apples. In this reading comprehension activity, students read a book about apples then compare and contrast, make graphs, distinguish between fact and fiction and work in groups. Students work in...
Curated OER
Fossil Fuel and the Ticking Clock
Students study energy sources to learn about fossil fuels and environmental concerns. In this energy sources lesson, students watch demonstrations for various energy examples. Students find hidden pennies, make a bar graph on their data,...
Curated OER
Favorite Farm Animals
Students perform a study of farm animals and their babies. They compile a graph of their favorite farm animals. They utilize a spreadsheet worksheet which is imbedded in this plan.
Curated OER
Leveled Problem Solving: Histograms
In this using data, frequency table, and histogram to solve word problems instructional activity, students solve problems about prices of toys and numbers of toys sold to solve consumer mathematics problems. Students solve six problems.
Curated OER
The Cost of Life
Students research the salary for a career of interest. They consider what kind of lifestyle that career would provide and graph their information for comparison.
Curated OER
The Ice Cream Shop
Second graders read books about ice cream and plan an ice cream sundae party for the class. They research ingredients and determine how much the party cost each student. They hold a mock opening for an ice cream store and have their party.
Curated OER
Farming and the Services of a Community (Lesson 5)
Students identify different types of farms and services of a community. They use a pretend farm scenerio and a worksheet to distinguish between the different types of farms. They also practice using new vocabulary.
Curated OER
Farming: Seasons on a Wheat Farm (Lesson 4)
Students explain the seasons on a wheat farm. They identify the uses of a grain elevator as well. They use a dry erase board to illustrate the seasons and the grain elevator in operation.
Curated OER
Farming: Natural Resources (Lesson 2)
Students identify the types of natural resources. They explain the difference between weather and climate. They practice using a rain gauge and reading a thermometer.
Curated OER
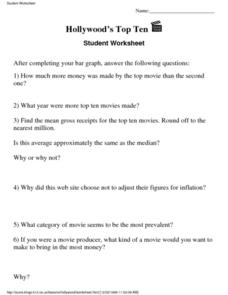
Hollywood’s Top Ten
In this entertainment worksheet, students answer 6 questions about their top ten favorite movies. The questions have no right answer because they are subjective.
Curated OER
Quickest Round-Up
Learners perform activities requested by being timed and observed for compliance. They practice lining up to leave the class in a quiet manner. As they line up, students are observed to ensure good manners. Each class competes against...
Curated OER
Tourism in London
Students discuss the tourist attractions that are in London. They examine how data can be manipulated by completing a worksheet. They plan a trip to a London attraction after conducting Internet research.
Other popular searches
- Skittles Bar Graph
- Double Bar Graphs
- Bar Graphs Pictographs
- Histogram and Bar Graph
- Bar Graphs and Histograms
- Bar Graph Problem Solving
- Favorite Food Bar Graph
- Bar Graphs Histograms
- Interpreting Bar Graphs
- Bar Graphs for Birthdays
- Bar Graph Worksheet
- Bar Graphs and Charts
