College Board
Sampling Distributions
The validity of data depends on the strength of the sample. A collection of instruction and activities focuses on sampling distributions and the analysis of that data. Scholars learn about distribution tests such and Central Limit...
EngageNY
Experiments with Inscribed Angles
Right angles, acute angles, obtuse angles, central angles, inscribed angles: how many types of angles are there? Learners first investigate definitions of inscribed angles, central angles, and intercepted arcs. The majority of the lesson...
Radford University
Are Kitchen Cabinets at the Correct Height? Lessons 1-5
Here's a not-so-normal unit on normal heights. Future statisticians anonymously collect class data on female heights, weights, and shoe sizes. They then analyze the data using normal distributions, z-scores, percentiles, and the...
Inside Mathematics
Hopewell Geometry
The Hopewell people of the central Ohio Valley used right triangles in the construction of earthworks. Pupils use the Pythagorean Theorem to determine missing dimensions of right triangles used by the Hopewell people. The assessment task...
Mathematics Vision Project
Module 5: Circles A Geometric Perspective
Circles, circles, everywhere! Pupils learn all about circles, central angles, inscribed angles, circle theorems, arc length, area of sectors, and radian measure using a set of 12 lessons. They then discover volume formulas through...
College Board
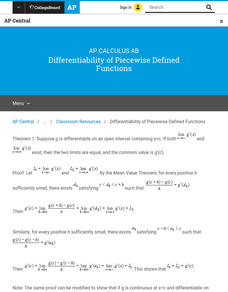
Differentiability of Piecewise Defined Functions
Differentiable or not, that is the question. An informational website gives two theorems on the differentiability of piecewise functions at their endpoints. It goes on to apply the theorems to present two solution methods to a past AP®...
College Board
Why Variances Add - And Why It Matters
Why is adding variance important? A lesson outline defines a variance theorem and how it affects the data statistics. The instruction shows scholars the importance of considering the variance of data and why it requires independence.
Curated OER
Discussion Sheet 2: Domain and Range
In this domain and range worksheet, students determine the domain and range of a function, compute the limits of a function, and use the intermediate value theorem to verify that an equation is solvable. This one-page worksheet contains...
Statistics Education Web
Who Sends the Most Text Messages?
The way you use statistics can tell different stories about the same set of data. Here, learners use sets of data to determine which person sends the most text messages. They use random sampling to collect their data and calculate a...
Statistics Education Web
The Egg Roulette Game
Hard boiled or raw? Which egg will you get? A hands-on activity has scholars explore the impact of conditional probability. Based on a skit from the Tonight Show, pupils model the selection of the two types of eggs using beads. They...
Curated OER
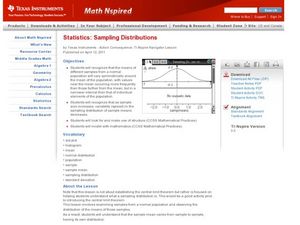
Sampling Distributions
Students analyze sampling from different population. For this statistics lesson, students define the meaning of sample sizes and what causes an increase or decrease. They graph their data on the Ti calculator and draw conclusion from the...
Mathematics Vision Project
Circles: A Geometric Perspective
Circles are the foundation of many geometric concepts and extensions - a point that is thoroughly driven home in this extensive unit. Fundamental properties of circles are investigated (including sector area, angle measure, and...
Curated OER
Embracing Diversity
Ninth graders discover that the amount surveyed affects the results and conclusions drawn from a survey. In this sampling lesson students explore the concept that a valid conclusion require a large number of entries. Students calculate...
Curated OER
Sampling Distribution of Sample Means
Students collect data and crate a distribution sample. In this statistics lesson, students compare and contrast their collected data. This assignment requires the students to be comfortable with navigating the internet.


