University of North Carolina
Figures and Charts
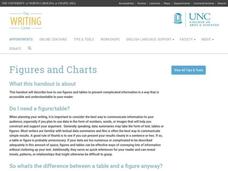
Sometimes words aren't the best way to get information across to the reader. The eighth handout in the 24-part Writing the Paper series describes different type of figures and charts to display complex information in a paper....
ProCon
Israeli - Palestinian Conflict
Many people think the best solution to the Israeli-Palestinian conflict is a two-state solution. After reviewing the available resources, scholars determine whether they agree with that approach. They analyze graphs and charts about...
Curated OER
College Education
What do Bill Gates and Mark Zuckerberg have in common? They're both billionaires, and neither one has a college degree! Using the website, scholars explore whether having a college education is truly worth the money it costs. They read...
Curated OER
Corporate Tax Rate and Jobs
Does lowering the corporate tax rate help create jobs in the United States? Learners explore the top pro and con arguments and quotes relating to the issue. They read background information about the creation of the federal corporate...
ProCon
Gun Control
According to some estimates, there are more guns than people in the United States. Learners decide if America should enact more gun control laws. They analyze information about gun deaths in the United States by year, read about the...
Other
Visual Complexity: Visualizing Complex Networks
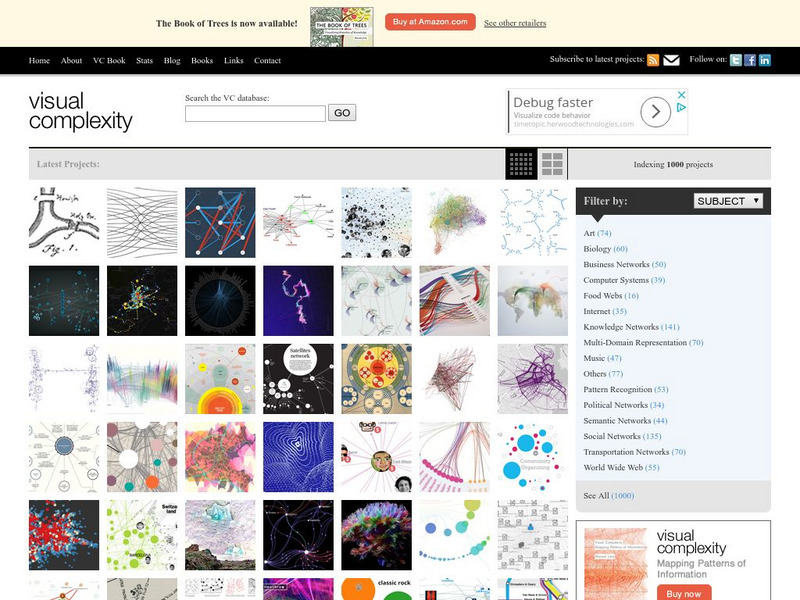
Examples of over 300 differnt types of maps, flow charts, and graphs. Emphasis is placed on the artistic and aesthetic qualities of the maps' visual components.
United Nations
United Nations: Dept. Of Social and Economic Affairs: Population Division
United Nations information on population issues of the world. Examples include long-range population projections, international migration, and population charts and graphs.
Other
The Elephant Sanctuary
Learn about the facility, view live and archived videos of the resident elephants and learn their histories and that of elephants in general. Visit the photo gallery and read the newsletter and other news from "around the globe". In...
Other
Honolulu Hi 5: Cool Maps With Awesome Weather Data Across 1,219 Us Cities
Explore the weather in states and cities across the United States. Two maps with accompanying graphs are provided. The first indicates the number of comfortably warm summer days a place has and the second shows the temperature and how...
Other
Carbon 14 Dating
Seven pages all about Carbon 14 Dating. Information on half-life, Carbon 14 used to date specimens and artifacts, limitations, charts and graphs. Michael E. Brown Ph.D. contests that the limitations of Carbon 14 dating support the theory...
Other
The Edwards Aquifer: Homepage
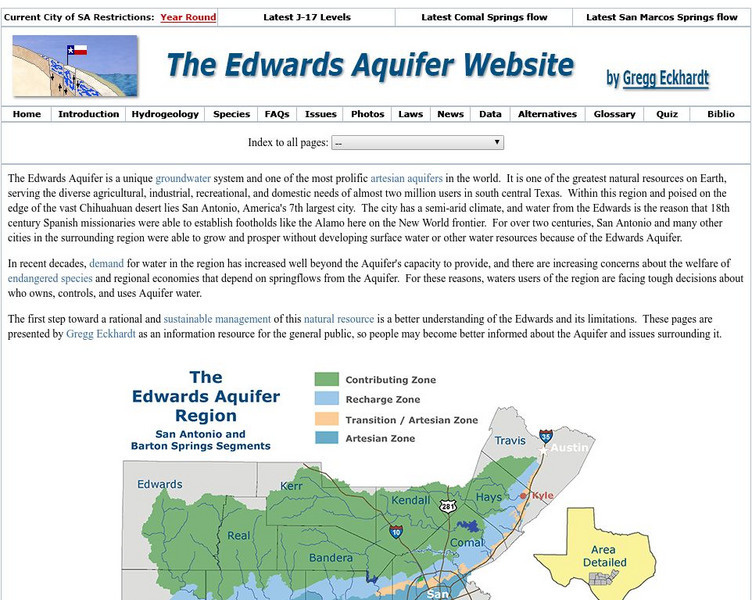
In hopes of informing the citizens of the Edwards Aquifer region, Gregg Eckhardt has set up a site presenting facts about the Edwards Aquifer in Texas. Included are links to questions and answers, endangered species, charts and graphs,...
Other
Federal Reserve Bank of Cleveland: Inflation Central
Students track inflation in the United States and across the world. The resource consists of articles on economic trends, economic commentary, charts, and graphs.
University of Illinois
University of Illinois: Lesson on Linear Regression
This site from the University of Illinois gives lessons that explain linear regression in detail by using many charts and examples.
United Nations
Unesco: Math Games (In Arabic)
This site offers games and lessons that teach basic math concepts such as area and volume, number patterns, time, etc. Games use familiar tasks such as shopping to reinforce math concepts. While the title of each page includes an English...
abcteach
Abcteach: Dinosaurs
[Free Registration/Login Required] This resource features a variety of activities related to dinosaurs. There are interdisciplinary tasks that include writing exercises such as creative writing and story planner formats. Lessons for...
American Museum of Natural History
American Museum of Natural History: O Logy: The Tree of Life
Learn about the diversity of species on Earth by exploring a cladogram, a graph-like tree of life that illustrates relatedness among species. Includes instructions for reading cladograms and a pie chart that summarizes the percentages of...
Other
Public Agenda Online
Nonpartisan examination of issues facing the American public. Includes subject overview, a collection of recent news coverage, graphs and charts, various perspective pieces, major proposals relative to the issues, as well as an...
Other
Interactive Learning Center: Dow Jones Industrial Average
This interactive learning center teaches about the history of the Dow Jones Industrial Average (DJIA). Complete with graphs, charts, history timelines, and quizzes.
Other
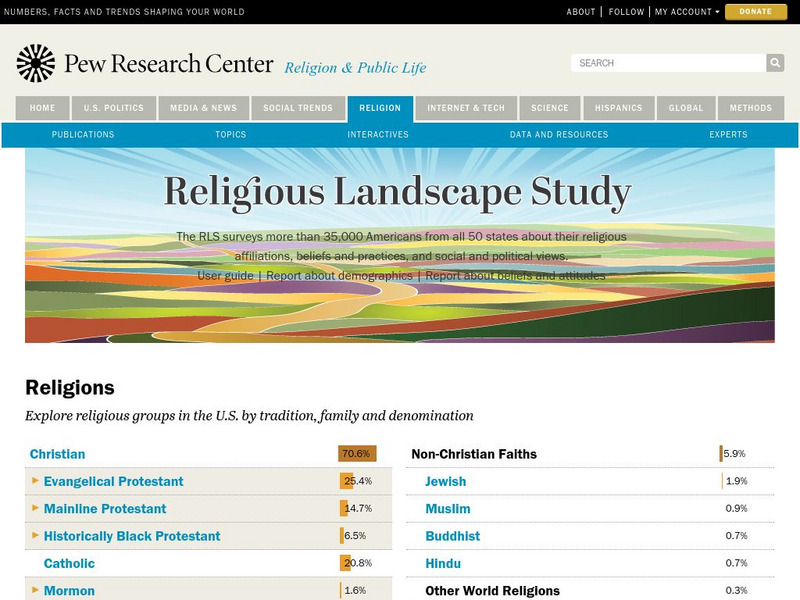
Pew Forum on Religion and Public Life: u.s. Religion Landscape Survey
Website summarizing the results of a survey on religion in the U.S. Contains maps and charts of information for each specific religion as well as bar graphs comparing the deomographics of the different religious groups. Two full reports...
National Institutes of Health
Niddk: Weight Loss for Life [Pdf]
This site from the NIDDK provides all the information needed for making smart, long term weight loss decisions. Plenty of graphs, charts, and statistics. Defines diet and exercise terms.
Robert Schenk, PhD
Cyber Economics: Supply and Demand Overview
This is a site from the St. Joseph's College with an overview of the supply and demand model. It is actually the first page of a lesson on supply and demand complete with links to more in-depth discussions including graphs and charts...
Other
The Silver Institute: Silver Production
This page gives detailed information about world silver production. Contains graphs and charts of the production of various countries and top-producing companies.
Other
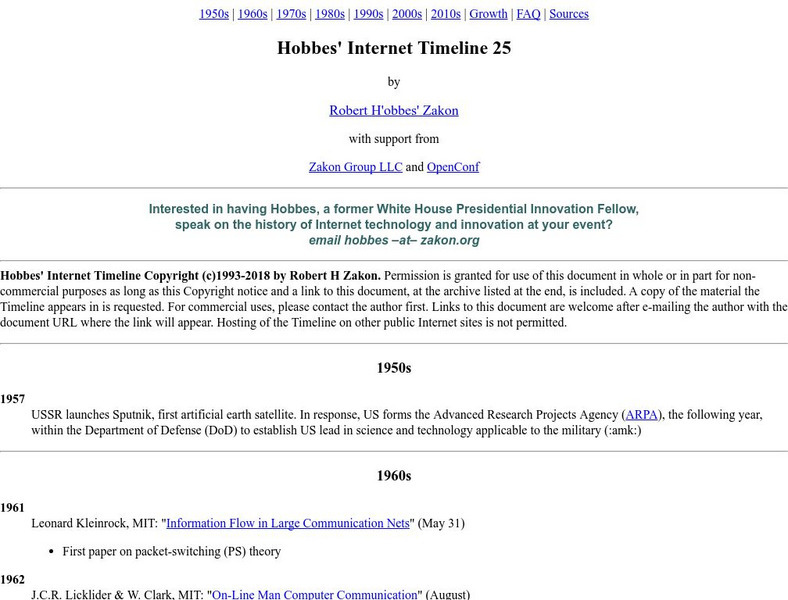
Hobbes' Internet Timeline
A comprehensive timeline of the internet. Includes excellent graphs and charts illustrating internet trends.
Other
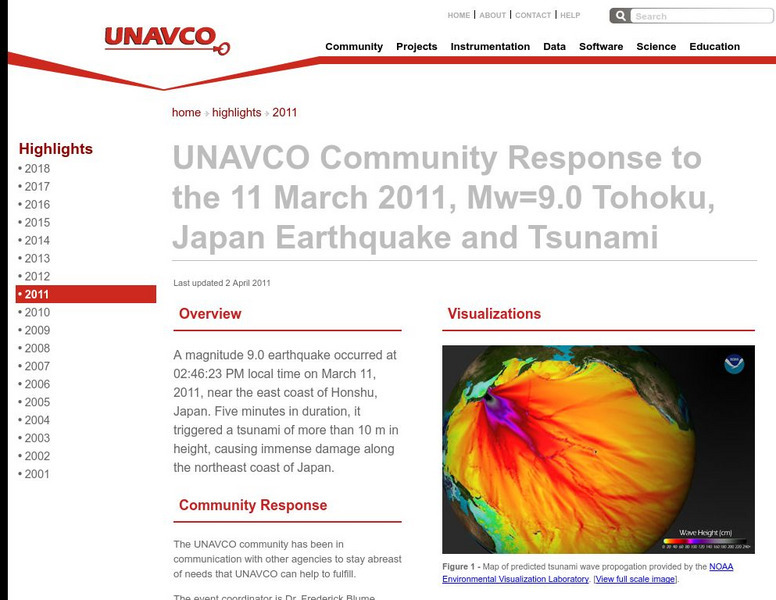
Unavco: Event Response to the Mw=9.0 Tohoku, Japan Earthquake and Tsunami
Relevant data connected to the earthquake as well as links to technical information and science websites. Also find many graphs and charts with information on the tectonic activity.
Other popular searches
- Pie Charts and Graphs
- Reading Charts and Graphs
- Behavior Charts and Graphs
- Charts and Graphs Candy
- Interpret Charts and Graphs
- Charts and Graphs Christmas
- Charts and Graphs Math
- Analyzing Charts and Graphs
- Tables, Charts and Graphs
- Charts and Graphs Europe
- Using Charts and Graphs
- Bar Graphs and Charts
