Hi, what do you want to do?
PBS
Pbs Learning Media: Hedy Lamarr: Engineering and Invention
Discover Hedy Lamarr's contributions as a woman in STEM in this video from the American Masters film, Bombshell: The Hedy Lamarr Story. Lamarr has received belated acknowledgement for inventing frequency hopping, the basis of secure...
Texas Education Agency
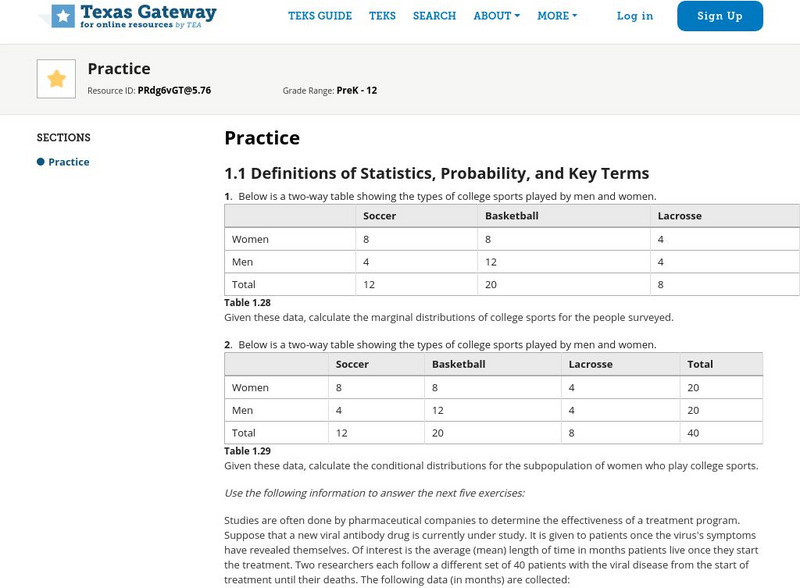
Texas Gateway: Tea Statistics: Sampling and Data: Practice
A set of exercises where students must analyze statistcal data and methodology and answer questions about distributions, sampling, results, accuracy, frequency, experimental design, and ethical practices.
CK-12 Foundation
Ck 12: Statistics: Histograms Grades 9 10
[Free Registration/Login may be required to access all resource tools.] Make a histogram given a frequency table.
Mangahigh
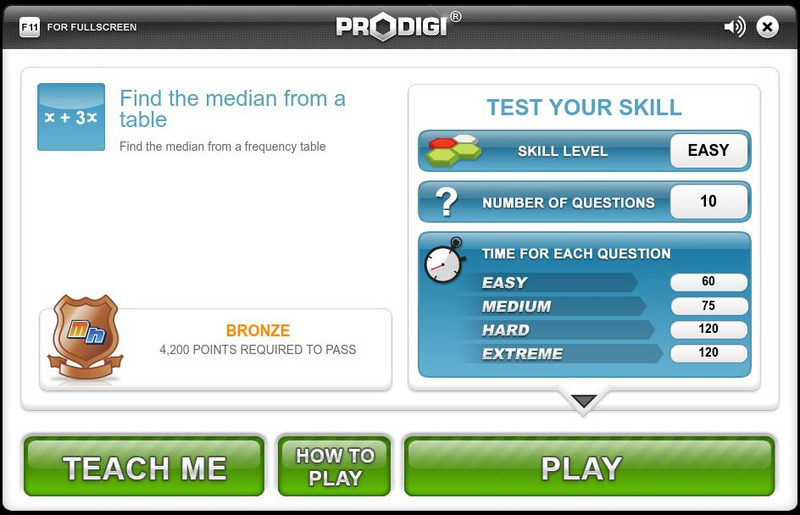
Mangahigh: Data: Find the Median From a Table
Students learn about the concept of median by exploring a tutorial. They can then test their knowledge by taking a ten question assessment that increases in difficulty as they correctly answer questions.
Alabama Learning Exchange
Alex: Get on Your Mark, Get Set, Go!
In collaborative/cooperative groups, middle schoolers will review basic vocabulary and concepts for data and statistics. Students will create, collect, display, and interpret data in the form of frequency tables, bar graphs and circle...
Alabama Learning Exchange
Alex: Heads Up!
The lesson is a hands-on project. Students will work in pairs to gather various measurements, organizing the data into a provided chart. The measurements will be used to review, reinforce, and introduce skills such as measures of central...
ClassFlow
Class Flow: Cumulative Frequency Data Handling
[Free Registration/Login Required] Students draw conclusions and engage in tables and charts involving cumulative frequency; a wonderful review of student's knowledge.
Varsity Tutors
Varsity Tutors: Hotmath: Practice Problems: Tables and Graphs
Six problems present various aspects of using and making tables and graphs to display statistics. They are given with each step to the solution cleverly revealed one at a time. You can work each step of the problem then click the "View...
Texas Instruments
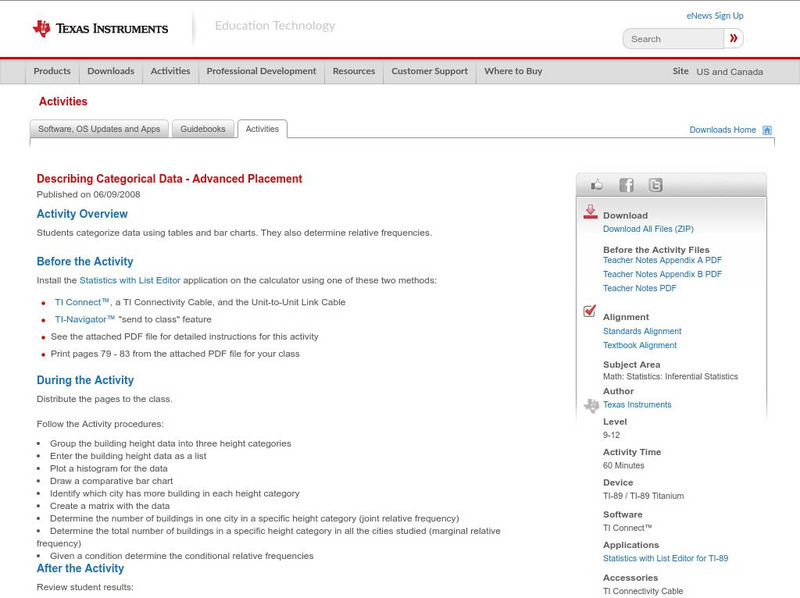
Texas Instruments: Describing Categorical Data Advanced Placement
Learners categorize data using tables and bar charts. They also determine relative frequencies.
Physics Classroom
The Physics Classroom: The Wave Equation
A thorough explanation of the wave equation (Speed = Wavelength * Frequency). A data table and questions to check one's understanding are also part of this lesson.
Other
Stat Soft: Statistics Glossary
Dozens of statistical terms are defined and illustrated in this glossary.
Texas Education Agency
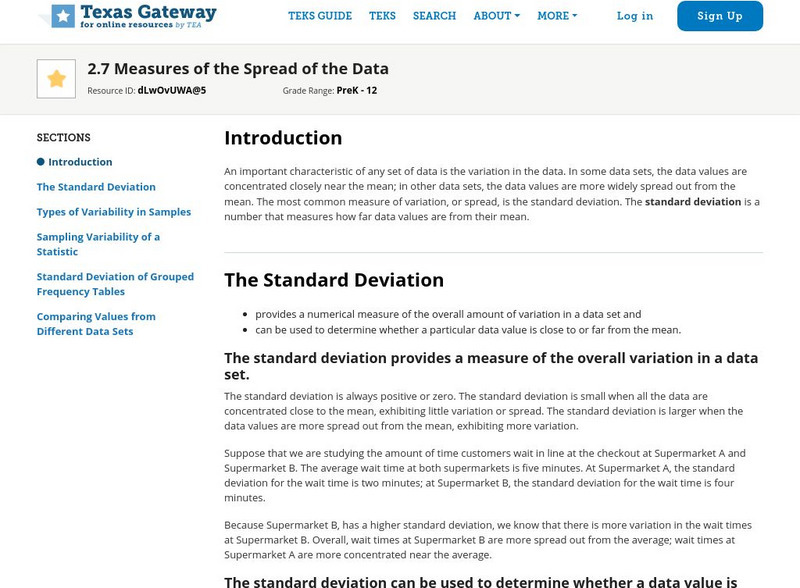
Texas Gateway: Tea Statistics: Measures of the Spread of the Data
This resource explains the different measures of center, variability, etc. that are used to describe the spread of statistical data. Includes examples and practice exercises.
Illustrative Mathematics
Illustrative Mathematics: What's Your Favorite Subject
This website provides a task in which students interpret data in a two way table by calculating the relative frequencies of a data set.
Khan Academy
Khan Academy: Creating Dot Plots
Practice creating dot plots. Dot plots are very similar to frequency tables, but they make it easier to see the data. Students receive immediate feedback and have the opportunity to try questions repeatedly, watch a video or receive hints.
Other
Story Arts: Listening Skills Table for Storytelling
Two rubrics to assess a listener's attention during a storytelling session. The first is used to record frequency of audience reactions. The second is used to access the listener's level of comprehension.
Knowledge Share
Super Kids: Hangman
Use this interactive site to enhance students' spelling and vocabulary while refreshing their memories in history, geography, language, science, and entertainment. It is available to use on line or you can purchase leveled apps for the...
CK-12 Foundation
Ck 12: Statistics: Ungrouped Data to Find the Mean
[Free Registration/Login may be required to access all resource tools.] Covers frequency distribution tables with ungrouped data.
CK-12 Foundation
Ck 12: Statistics: Grouped Data to Find the Mean
[Free Registration/Login may be required to access all resource tools.] Covers frequency distribution tables with grouped data.
University of Texas at Austin
Mathematics Teks Toolkit: The Sounds of Music
In this lesson, students collect data, graph it, then determine the period and frequency of the sound waves made by a guitar.
Other
Bowling Green St Univ: Introduction to Probability
This site from Bowling Green State University provides an introduction to probability. It discusses topics and activities such as interpreting odds, listing all possible outcomes (the sample space), basic probability rules, equally...
Alabama Learning Exchange
Alex: How Long Will It Take?
In this instructional activity, students will participate in a group activity using a sponge ball and a growing human circle. The students will be added to a circle in groups of two and will pass the sponge ball from hand to hand until...
Quia
Ixl Learning: Histograms
Brush up on your math skills relating to histograms then try some practice problems to test your understanding.
CK-12 Foundation
Ck 12: Statistics: Bar Graphs Grades 9 10
[Free Registration/Login may be required to access all resource tools.] Make a bar graph to display given data.
Purple Math
Purplemath: Stem and Leaf Plots
Explains how to create a stem-and-leaf plot from a data set. Demonstrates how to format a clear stem-and-leaf plot.
Other popular searches
- Frequency Tables Line Plots
- Math Frequency Tables
- Making Frequency Tables
- Reading Frequency Tables
- Creating Frequency Tables
- Cumulative Frequency Tables
- Frequency Tables 7th Grade
- Intro to Frequency Tables
- Making Frequency Tables Quiz


