Curated OER
Create a Bar Graph
In this bar graph worksheet, learners use a set of clues about favorite types of books to draw the bars on a graph. Answers are included on page 2.
Curated OER
Bar Graph Activity: Spelling Bee
In this bar graph worksheet, students use information about a class spelling bee, shown in a bar graph, to complete a set of 7 related questions. Answers included on page 2.
Curated OER
Charts and Graphs
In this charts and graphs worksheet, students refer to charts and graphs to solve word problems. Students complete 10 multiple choice word problems.
Curated OER
Census Statistics and Graphing
Learners graphically represent data from the Census. In this middle school mathematics lesson plan, students investigate the housing characteristics of different tribes of Native Americans and compare them to the average American...
Curated OER
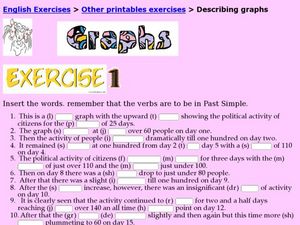
Graph Vocabulary
In this graph vocabulary interactive worksheet, students enter the appropriate graph words using the first letters as clues to the words. They look at a graph for clues and use verbs that are in the past simple. They complete 21 examples...
Curated OER
Graphing in the Form of Bar Graphs
Students explore bar graphs. In this math instructional activity, students create and conduct a survey. Students graph their data in a bar graph.
Curated OER
Bar Graphs and Pie Charts
Fourth graders explore their interest and strengths and display them using a bar graph and pie chart.
Curated OER
St. Patrick's Day Lucky Charms Sort Bar Graph
In this elementary data collection and graphing worksheet, students paste the correct cereal pieces to match the words at the bottom of the bar graph. They count the items and fill in the graph in this St. Patrick's Day themed activity.
Curated OER
Graphing Parabolas
In this graphing parabolas worksheet, 10th graders solve 10 different problems that include graphing various parabolas using the given information. First, they determine the equation of the axis of symmetry for a parabola with a given...
Curated OER
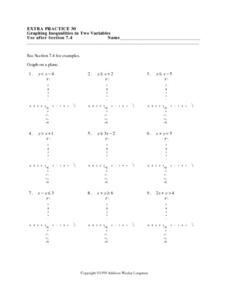
Graphing Inequalities in Two Variables
In this graphing inequalities worksheet, students shade 3 inequality problems. Students then graph and shade 4 additional inequalities.
Curated OER
Favorite Sports Graph
In this data collection and graph worksheet, students ask each classmate which sport is their favorite based on the ones shown at the bottom of the graph. They color a square for each response, and tell the most and least popular sport.
Curated OER
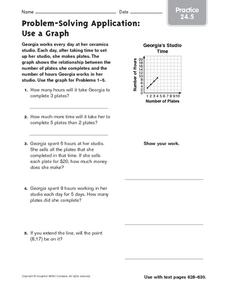
Problem-Solving Application: Use a Graph: Practice
For this graphing coordinates worksheet, students study the graph and the coordinates. Students then answer the five questions about the graph and show their work.
Curated OER
Problem-Solving Application: Use a Graph: Problem Solving
In this graph usage worksheet, students read the word problem and then learn to use a math graph by following the steps of understand, plan, solve, and look back.
Curated OER
Problem Solving: Use a Graph: Problem Solving
In this bar graph worksheet, students read the word problem and use the bar graph to complete the problem solving questions for understand, plan, solve, and look back.
Curated OER
Using Graphs and Charts
Students complete T charts and manipulate numbers using graphs and charts. In this math graphs and charts lesson, students review the concepts of pattern and function. Students then complete practice pages where they manipulate numbers...
Curated OER
Seized Before Flights: Graph
In this bar graph learning exercise, students analyze a graph that show the number of prohibited items intercepted at U.S. airport screening checkpoints. Students answer 3 problem solving questions about the data on the graph.
Curated OER
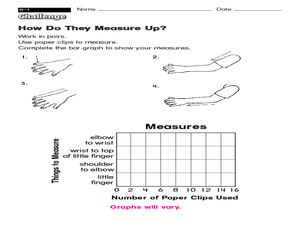
How Do They Measure Up? Measure and Graph
In this measure and graph worksheet, students use paper clips to measure various lengths shown, then bar graph their results, a total of 4 measurements.
Curated OER
Describing Graphs
In this graphs worksheet, students fill in the blanks to sentences to describe graphs. Students complete 19 sentences total on this worksheet.
Curated OER
Free Fall Graphing Exercise
Twelfth graders practice their graphing skills in an exercise about acceleration due to gravity. Lesson opens with a demonstration of acceleration due to gravity and a brief discussion. Students complete a worksheet and go over answers...
Curated OER
Hygiene Potato Graphs
Fifth graders discuss the importance of proper hygiene. After watching their teacher peel potatoes, they discuss why she was wearing rubber gloves. They demonstrate how to wash their hands properly and why one should never touch...
Curated OER
Reading Immigration Graphs and Charts
Students examine the settlement patterns and land use in Minnesota. In groups, they practice reading immigration graphs and charts and discuss why immigrants settled where they did. They are also introduced to new vocabulary related to...
Curated OER
M&M's Candies Worksheet Graph
In this graphing worksheet students will record data on a bar graph. Students will take a bag of M&M's and chart the colors they find inside this bag.
Curated OER
Graphing Inequalities in Two Variables: Extra Practice 30
In this math worksheet, students graph inequalities on a coordinate grid. The eight problems have a coefficient of one for the y variable. Three problems have a negative value for y. The final four problems are horizontal or vertical lines.
Other popular searches
- Coordinate Graphing Pictures
- Charts and Graphs
- Graphic
- Graphic Organizers
- Graphing Ordered Pairs
- Bar Graphs
- Circle Graph
- Vertex Edge Graph
- Graphing Skills Lesson Plans
- Graphic Design
- Line Graphs
- Double Bar Graph


