Curated OER
The Great Pollinators
Students discover the reproductive parts of a plant. In this biology lesson, students identify and categorize several different plants they dissect in class. Students record their information using a data chart.
Curated OER
Scatter Plots
Seventh graders investigate how to make and set up a scatter plot. In this statistics lesson, 7th graders collect data and plot it. They analyze their data and discuss their results.
101 Questions
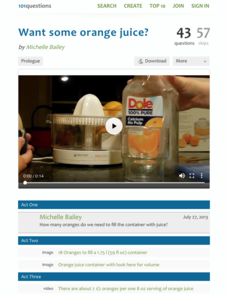
Want Some Orange Juice?
Juice up your lessons with an open-ended resource. Scholars must determine how many oranges it takes to fill a container with juice. They use information presented in a video and as images to find the solution.
Curated OER
Tally Time
Students create a tally chart. In this math and health lesson plan, students discuss healthy foods and create a tally chart showing the number of students who like to eat healthy foods.
Curated OER
Introduction To Functions
Students define a functions and solve problems using functions. In this algebra lesson, students differentiate functions from non-functions. They differentiate between polynomials of higher degrees.
Curated OER
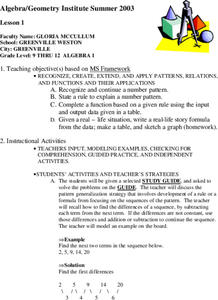
Patterns, Relations, and Functions
Students investigate the patterns of different data sets of numbers. They use critical thinking skills in order to find the missing numbers in any given set. This activity helps to develop the skill of number sense.
Curated OER
Determine the Coordinate of Transformations
Students investigate transformation on a coordinate plane. In this geometry lesson, students identify pairs of coordinates and their location on the grid. They perform rotation and reflection of each polygon.
Curated OER
Completing Frequency Diagrams from Displayed Data
In this frequency diagram worksheet, students use a bar chart, stacked bar chart and pie chart to complete frequency tables. A reference web site is given for additional activities.
Curated OER
Ratios
Sixth graders investigate the concept of ratios and how they can be used to represent the comparison of quantities. The lesson is taught using a table or graph to compare two categories of data.
Curated OER
And the Survey Says...
Students use technology to input, retrieve, organize, manipulate, evaluate, and communicate information; apply appropriate technologies to critical thinking, creative expression, and decision-making skills. They collect and explore data...
Curated OER
Mixed Math Review
In this mixed math review instructional activity, students solve 40 problems pertaining to missing numbers in math sentences, rounding, number sequences and plotting data from a table to a graph.
Curated OER
Exponential Decay Functions
In this exponential functions activity, students solve and complete 13 various types of problems. First, they state whether the table represents an exponential function or not and why. Then, students graph each function and identify its...
Curated OER
Charging Up, Charging Down: Exponential Models
Students collect and analyze voltage data. In this math instructional activity, students investigate exponential functions using the TI and a Voltage Probe. They graph their data and analyze it using a table.
Curated OER
Don’t Sit Under the Apple Tree…You Might Become Famous
Students explore Newton's laws using CEENBoTs. In this physics lesson, students collect data and create tables and graphs. They calculate speed, acceleration and forces using mathematical formulas.
Curated OER
Awesome Animals
Students collect data from classmates about their favorite animal. They use the ClarisWorks graphing program to enter data, graph results, and interpret data.
Curated OER
Quadratic Functions
Students graph quadratic equations on paper and check their results on the graphing calculator. They predict the direction of the graph and the vertex point. Students use the vertex, axis of symmetry and knowledge of which direction the...
Curated OER
Give It Back From a Snack Lesson 2: Invest With the Best
Students survey schoolmate as to what type of snacks they would prefer to purchase. They graph the results and apply them to planning a classroom snack sale while examining what wants, needs, and consumers are.
Curated OER
Holiday Tally
In this tally chart worksheet, students ask ten friends which of 3 holidays they like best. Students create a tally chart with their results and answer 6 questions.
Curated OER
Histograms and Statistical Graphics
In this statistics worksheet, students solve 6 data problems. They construct a histogram of given data, they create a frequency polygon, and a stem and leaf diagram. Students create a dot plot and a pie chart for given data sets. On the...
Curated OER
My Peanut Butter is Better Than Yours!
Students explore the concept of statistical data. In this statistical data lesson, students read an article about the dangers of peanut butter to those who are allergic. Students perform a taste test of two different brands of peanut...
Curated OER
Data and charts
In this data and charts worksheet, students answer multiple choice questions referring to different charts about mountain heights, breakfast drinks, and more. Students complete 10 multiple choice questions.
Curated OER
Integrated Algebra Practice: Histograms
In this histogram worksheet, students solve 6 multiple choice and short answer problems. Students read histograms and determine the frequency of a particular item.
Curated OER
Breakfast Cereal - How Nutritious Is Yours?
Young scholars analyze the nutritional value of breakfast cereal in order to make an informed choice. They create a stem and leaf plot which analyzes the nutritional value of the cereal they eat on a regular basis. Students write a...
Curated OER
Pie Charts
In this math learning exercise, students complete the work in order to chart the data into the pie graph. The picture is used for statistical analysis.
Other popular searches
- Tables, Charts and Graphs
- Function Tables and Graphs
- Tables and Graphs
- Tables Charts and Graphs
- Create Data Tables From Graphs
- Math Tables and Graphs
- Reading Tables and Graphs
- Data Displays and Graphs
- Tables, Graphs, Charts
- Using Graphs and Tables
- Making Tables and Graphs
- Data Tables and Graphs


