Curated OER
Genome: The Secret of How Life Works
What do you have in common with a fruit fly? About 60 percent of your DNA. The resource, divided into two units, is intended for grades four to eight and another for high schoolers. Both units include eight lessons covering the...
Mathematics Vision Project
Module 2: Systems of Equations and Inequalities
The brother-sister pair Carlos and Clarita need your class's help in developing their new pet sitting business. Through a variety of scenarios and concerns presented to the siblings, the learners thoroughly explore systems of equations...
Curated OER
Drive the Data Derby
Three days of race car design and driving through the classroom while guessing probability could be a third graders dream. Learn to record car speed, distances traveled, and statistics by using calculation ranges using the mean, median,...
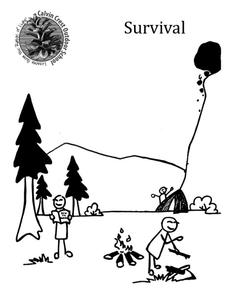
Calvin Crest Outdoor School
Survival
Equip young campers with important survival knowledge with a set of engaging lessons. Teammates work together to complete three outdoor activities, which include building a shelter, starting a campfire, and finding directions in the...
Association of American Geographers
Project GeoSTART
Investigate the fascinating, yet terrifying phenomenon of hurricanes from the safety of your classroom using this earth science unit. Focusing on developing young scientists' spacial thinking skills, these lessons engage...
Mathematics Vision Project
Geometric Figures
Logical thinking is at the forefront of this jam-packed lesson, with young mathematicians not only investigating geometric concepts but also how they "know what they know". Through each activity and worksheet, learners wrestle with...
Texas Education Agency
Texas Gateway: Introduction to Probability
This activity provides the opportunity to explore the difference between finding the probability of independent events and dependent events. It also addresses how to use a tree diagram when calculating conditional probabilities.
Sophia Learning
Sophia: Introduction to Probability
Introduction to Probability is a resource that provides assessment and teacher tutorials that focus on mathematic concepts such as probability, outcomes, events, probability distribution, laws, values and odd.
CK-12 Foundation
Ck 12: Write and Compare Probabilities as Fractions, Decimals and Percents
[Free Registration/Login may be required to access all resource tools.] Explains how to represent a probability in the format of fractions, decimals, and percent. Includes a probability problem with a set of sixteen questions, and a...
CK-12 Foundation
Ck 12: Introduction to Data and Measurement Issues Grades 11 12
[Free Registration/Login may be required to access all resource tools.] This Concept familiarizes students with data analysis and statistical terminology.
Khan Academy
Khan Academy: Introduction to Residuals
Build a basic understanding of what a residual is.
Khan Academy
Khan Academy: Markov Chains
The concept of modeling sequences of random events using states and transitions between states became to known as Markov Chains. Introduction to Markov chains. Created by Brit Cruise.
Texas A&M University
Wtamu Virtual Math Lab: Beginning Algebra: Reading Graphs
A good introduction to reading bar, line, and double line graphs, and drawing and reading Venn diagrams. Contains definitions and examples of these types of charts and graphs as well as practice exercises that ask you to answer questions...
Khan Academy
Khan Academy: Scatterplots and Correlation Review
A scatterplot is a type of data display that shows the relationship between two numerical variables. Each member of the dataset gets plotted as a point whose x-y coordinates relates to its values for the two variables.
Khan Academy
Khan Academy: Linear Regression Review
Linear regression is a process of drawing a line through data in a scatter plot. The line summarizes the data, which is useful when making predictions.


