Curated OER
Line Symmetry
In this line symmetry practice worksheet, students sharpen their problem solving skills as they solve 6 story problems.
PBS
The Housing Crisis: GDP, Housing Bubble, Recession
Secondary pupils examine the housing bubble and the 2008 and global economic crisis. Defining GDP and GDP growth, recession, and bubbles, young economists debate what makes a bubble and how housing can be an economic indicator. Small...
Curated OER
Awareness of Pre-Algebra Concepts
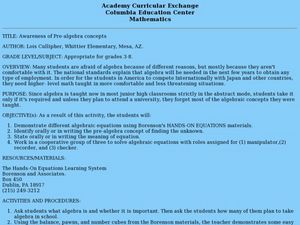
Young scholars demonstrate how to solve various algebraic equations. In this pre-algebra activity, students work in teams and use Borenson's Hands-On Equations materials to solve algebraic equations.
Curated OER
Zoo groups
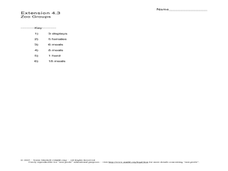
In this zoo animals instructional activity, students read about a particular zoo animal and answer the math word problems about the amount of meals, pounds, herds, and more. Students complete 6 problems.
Curated OER
My Test Book: Standard and Expanded Form
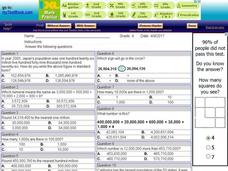
In this online interactive math skills worksheet, students solve 10 multiple choice math problems regarding standard and expanded form. Students may view the correct answers.
Curated OER
How much rice to US farmers grow?
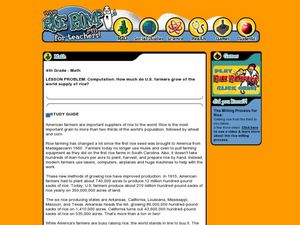
Fourth graders examine rice farming. In this rice farming lesson, 4th graders compute how much of the world's rice the US produces. Students gain information about the history of growing rice and how much rice other countries grow as...
Curated OER
Investigating Transformations
In this trigonometry instructional activity, students investigate the transformations that can occur to the basic trigonometric functions. The thirteen page instructional activity contains explanation, examples, and forty-seven...
Curated OER
Analyzing Country Data
Young scholars analyze different data in percentage form. In this statistics lesson, students plot data using box-plots, dotplot, and histogram. They compare and contrast the collected data using the boxplot.
Curated OER
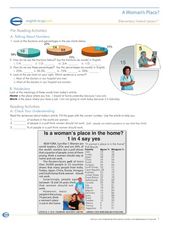
A Woman's Place?
In this women workers lesson, students read an article about women in the workforce and answer 10 questions related to the article. They also convert fractions to percentages.
Curated OER
Shells
Students participate in an activity that reinforces their skills with subtracting of two-digit numbers. They read in their Math Storybook's about seashells on the beach, hermit crab's and discuss how many they see and where did all the...
Curated OER
Size Per Unit
Fifth graders investigate how to find the average and the concept of a per unit quantity and its applications. They also make connections of using population density and how to find the speed with its relating formula. This is bringing...
Curated OER
Awareness of Pre-algebra Concepts
Learners work in a cooperative group of three to solve algebraic equations with roles assigned for manipulator, recorder, and checker. They utilize hands-on learning materials imbedded in the lesson plan.
Curated OER
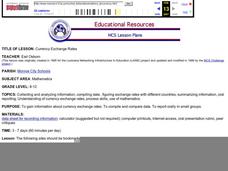
Currency Exchange Rates
Students, in groups, choose three countries from which to investigate exchange rates versus the US dollar. Using Internet research they follow daily exchange rates and compute the percentage change. They compile data and prepare and...
Curated OER
Applications and Problem Solving
In this math worksheet, students apply the skills of reading and critical thinking in order to create the solutions to the word problems.
Curated OER
Graph: Number of Laysan Albatross Nests and Chicks at Kilauea Point
In this bar graph worksheet, students solve and complete 2 problems related to reading a bar graph. First, they use the data table found at the bottom of the sheet to complete the bar graph which illustrates the number of nests and...
Curated OER
Subtract Greater Numbers
In this subtracting greater numbers learning exercise, students use the table for the 'Shipping Fleets Around the World' to help them solve the subtraction word problems that use greater numbers.
Curated OER
Money Matters
Pupils explore the concept of money. In this money instructional activity, students role play an economy. Pupils are divided into three categories- the money factory, construction workers, and the grocery store. Students work...
Curated OER
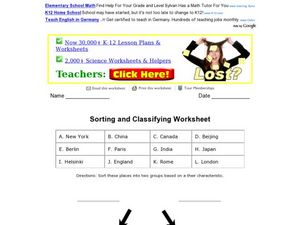
Sorting and Classifying Places
In this sorting and classifying worksheet, students sort a group of places into 2 groups based on a chosen characteristic. Worksheet contains a link for additional activities.
Curated OER
A New Century Of Flight
Students study an article on high speed travel. In this investigative lesson students students read an article, answer questions then work in groups to calculate problems.
Curated OER
Nine Examples for Tables, Pictographs, Mean. Median, and Mode
In this graphical representation of data and measures of central tendency worksheet, students calculate mean, median, and mode and answer questions related to graphs, tables, and pictographs.
Other popular searches
- Japanese
- Japan Geography
- Feudal Japan
- Japanese Film
- Japanese Art and Music
- Imperial Japan
- Japan History
- Japanese Culture
- Ancient Japan
- Japanese Internment
- Medieval Japan
- Japanese Art


