Curated OER
Data Analysis and Probability: Graphing Candy with Excel
Collect and graph data using Microsoft Excel with your math class. They will make predictions about the number of each colored candy in a bag of M&M's, then sort, classify, count, and record the actual data before using Excel to...
National Council of Teachers of Mathematics
Geogebra: Residuals and Linear Regression
If the line fits, use it. Using a Geogebra interactive, pupils plot points and try to find the best fit line. They assess the linear fit by analyzing residuals. A radio button allows participants to show the regression line and the...
Curated OER
Graphing on the Computer
Students create a bar graph on the computer using given information from the teacher. They create a bar graph using their own information chart (they need to create one on separate paper first). They utilize Microsoft Excel for this...
Curated OER
Fall Apple Unit
1. practice numeral recognition 1- 10 2. practice counting a set of concrete objects and match it to the corresponding numeral 3. identify a digital camera and learn to take a picture;The students will: 1. Listen to the book, "Ten Apples...
Curated OER
Math Prefixes
Students use a dictionary to gather appropriate information for writing simple definitions. They recognize prefixes that relate to numbers, such as mono-, bi-, and tri-. Pupils use their creative abilities to extrapolate new words to...
Curated OER
Credit Cards: The Good, the Bad, and the ugly
Students study how dangerous credit cards can be. They see why it is important to pay off credit card bills as soon as they can. They use MS Excel to display and understand the data. They fill out questions using the data from their...
National Council of Teachers of Mathematics
Seeing Music, Hearing Waves
In this music activity, 11th graders incorporate fractions into their music scales and counting scales. They listen to the music being played and relate it to sine waves reviewing the trig function. There are 11 questions involving sine...
Curated OER
Note Names & Piano Games
Students identify letter names of notes, demonstrate simple rhythms, and use that knowledge to play short melodic phrases using the educational software called BugBand. Handouts and a quiz to assess student achievement are included.
Curated OER
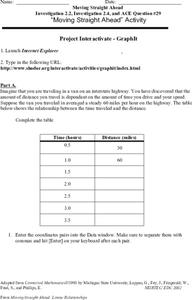
Moving Straight Ahead
In this functions worksheet, 9th graders solve and complete 24 various types of problems. First, they complete the table with the correct distance for each hour given. Then, students enter the coordinate pairs into the function table...
Curated OER
Amazing Fibonacci
Learners integrate the patterns of Fibonacci into music. In this geometry lesson, students apply the concepts of recursion, pattern and Phi or Golden Ratio to composing and playing music on various instruments. They lesson is co-taught...
Curated OER
Publisher Brochures
Students create brochures on subjects they are studying in Publisher. In this nonfiction writing lesson, students use Publisher to create a brochure telling all the main ideas of a topic they are studying. Students use text boxes, fonts...
Curated OER
Beginning Graphs in MS Excel
Students practice creating graphs in Microsoft Excel. In this technology lesson, students conduct a random survey and collect data. Students use the Microsoft Excel program to create a bar graph of the data.
Curated OER
How to Graph in Excel
Fourth graders construct data graphs on the Microsoft Excel program. In this statistics lesson, 4th graders formulate questions and collect data. Students represent their results by using Excel.
Curated OER
Excel for Beginners
In this Excel lesson plan, young scholars set a formula to check their homework. Students also use clipart, work in groups, and learn to use the tools in the drop-down list.
Curated OER
Solving Algebraic Problems
In this algebra instructional activity, 11th graders work algebraic word problems, solve for the unknown and combine like terms. There are 10 multiple choice questions with an answer key.
Curated OER
Global Warming Statistics
Students research real-time and historic temperature data of U.S. and world locations, and analyze the data using mean, median, and mode averages. They graph the data and draw conclusions by analyzing the data. A spreadsheet is used to...
Curated OER
The Discount Is Right
Students estimate and calculate the sale price of five items using the original price and a designated rate of discount. They use percent to calculate the rate of discount and the original.
Curated OER
Introduction to the Food Pyramid
Students review information on the food pyramid, either in printed works or on the Internet, to research healthy eating habits.
Curated OER
MAPPING YOUR NEIGHBORHOOD
Students uses atlases, maps, and Web resources to generate and examine maps of their own neighborhoods. This activity serve as background for the map-reading tasks in the next lessons.
Curated OER
State Economy Chart
Fifth graders research and record statistics on the economy of an assigned state. They create a spreadsheet in Excel to report the data and a 3D Pie graph using the Chart Wizard in Excel to represent their states' data.
Curated OER
The Discount is Right
Students visit various websites and calculate various prices of five items. They estimate the sale price of five items using the original price and discount rate, use percent to calculate the rate of discount and the original price, and...
Curated OER
Fact Families
Learners create "fact families" using digital pictures of their classmates and knowledge of basic math concepts (subtraction and addition) in this technology-based math lesson intended for use in the early-elementary classroom. A...
Curated OER
Fast Food Survey Using Bar Graphs
Second graders create a bar graph to pictorically represent the data collected from a survey of students. They use Excel to electronically create the graphs and data tallies. They then interpret their data using sentences to explain.
Curated OER
Whole Numbers
Student are assigned one of the sections on whole numbers. After reviewing the content, they teach their assigned sections to other class mates. They publish their findings on a PowerPoint slide show to use when they teach their section.
Other popular searches
- Computer Keyboard Diagram
- Computer Keyboard
- Blank Computer Keyboard
- Fun Keyboarding Activity
- Piano Keyboard
- Computer Keyboarding
- Lesson Plan on Keyboard
- Keyboard Game
- Keyboard Functions
- Midi Keyboard
- Keyboard Skills
- Keyboarding Lesson Plans


