Curated OER
Color by Number - Lighthouse Scene
In this lighthouse color by number worksheet, students practice their fine art skills and their number identification knowledge by coloring in a lighthouse and a sailboat sailing in choppy ocean waters.
Curated OER
Cruising
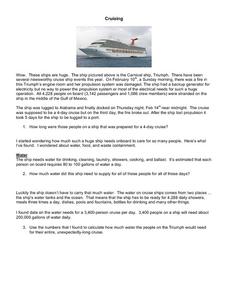
Cruise ships offer many engaging opportunities for real-world math adventures. These large, floating cities use resources with numbers into the thousands place. Young mathematicians are asked to calculate numerical information relevant...
Curated OER
Challenge Sheet 8: Kinetic Energy
In this kinetic energy worksheet, student set up equations that represent the kinetic energy of a rod with given parameters. They compute the volume of ocean water in a 2-mile radius, and sketch a graph of the information. This...
Curated OER
Water Water Everywhere and Not a Drop to Drink!
Middle schoolers describe limitations of fresh water resources on ships at sea. They realize the value of fresh water on the ocean and around the world. Students gain a knowledge of the process and economic cost of desalinization.
Curated OER
The Hudson's Ups and Downs
Even rivers have tides. Older elementary schoolers will discuss the Hudson River and how weather, water craft, and the ocean cause tidal fluctuation. They will examine a series of line graphs that depict tidal fluctuation, then analyze...
Curated OER
Catch a Wave
Students study low tides and how to calculate for fresh water. In this ocean science lesson, students pretend they are stranded on an island and must calculate low tide in order to source the fresh water aquifer. Students calculate how...
Curated OER
Scientific Investigation of Sea Ice Thickness
Young scholars study the importance of global ocean currents, sea water chemistry, and cultural issues surrounding sea ice. In the field, students travel to the floe edge with their teacher and an elder to drill holes in the ice and...
Curated OER
Understanding Oceans
Students investigate how ocean currents affect our world. In this ocean currents lesson, students perform an experiment to show how cold water is near the poles and warm water is near the equator. Students use water, food coloring, ice...
Curated OER
Math in Science-Sound Reasoning
In this basic math skills worksheet, students use division, decimals and multiplication to calculate the speed of sound in water and compare it to the speed in air. They calculate distances sound travels in water and the time it takes...
Curated OER
The Hudson's Ups and Downs
Fifth graders practice interpreting line graphs of the Hudson River water levels to assess the tides and tidal cycles in the estuary. They explore how weather can affect water levels and tides and observe that high tides and low tides...
Curated OER
Freshwater/Saltwater "Eggs-Periment"
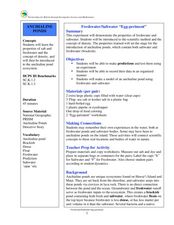
Students explore water properties by conducting a class experiment. In this buoyancy instructional activity, students utilize freshwater, saltwater, plastic cups, hard boiled eggs and food coloring to experiment with the floating...
Curated OER
The Hudson's Ups and Downs-Hudson River Activity
In this Hudson River worksheet, students read a short passage about the river, compare graphs of water levels at different locations, label high and low tides on a graph and interpret, and answer comprehension questions based on several...
Curated OER
Water and Land 207
Learners examine maps of different projections, mathematically calculate distortions, and note the advantages and disadvantages of each map. They study the different maps and transfer the map to graph paper.
Curated OER
Using Standard Deviation, part 2
Students explain and learn the practical application of standard deviation. They compare cities in the U.S. and discover whether cities closer to the ocean have more consistent temperatures. Useful resources are given.
Curated OER
Clarity And Turbidity
Students measure the clarity of a body of water and identify possible environmental complications that can be attributed to clarity and turbidity.
Curated OER
Make and Use a Plankton Net
Students make simple plankton nets and use them to collect and identify common forms of plankton. They identify and interpret plankton, as seen under a microscope, whether there was more zooplankton or phytoplankton. Finally, students...
Curated OER
A Message in a Bottle
Students investigate the motion of water currents by mapping the possible movement of messages cast into the ocean in bottles.They accurately plot the appearance of bottles on a world map and illustrate the flow of an ocean current...
Curated OER
PIZZA PARTS
Students will measure the ingredients to make pizza dough and determine basic fractions to cut pizza.Discuss where the different ingredients come from as you follow the instructions below to put the pizza together (flour from wheat,...
Curated OER
Fish Communities in the Hudson
Learning to read data tables is an important skill. Use this resource for your third, fourth, or fifth graders. Learners will will study tables of fish collection data to draw conclusions. The data is based on fish environments in the...
Illustrative Mathematics
Comparing Freezing Points
Subtracting negative numbers can be confusing to your middle schoolers. Here, they are able to draw a number line and put their answer in sentence form to check their understanding of negative numbers.
Beyond Benign
The Big Melt: Arctic Ice Caps
Are the Arctic ice caps really melting out of existence? Junior climatologists examine the statistics of ice decline through four math-based lessons. Each activity incorporates data, climate information, and environmental impact into an...
Balanced Assessment
Bumpy-Ness
Develop a new measure of the properties of an object. Scholars develop a definition and formula to measure the bumpy-ness of an object. They utilize their formulas to find the property for several spherical objects.
Curated OER
Measure for Measure
Young mathematicians work to recognize the relationship between their scale models of the Joides research vessel and the real vessel. They calculate the relationships between various parts of the ship using fractions, ratios, and...
Illustrative Mathematics
Mile High
What is the meaning of sea level? This resource helps your class understand the meaning of elevations above, below, and at sea level. Provides for good discussion on using positive and negative numbers to represent quantities in the real...
Other popular searches
- Ocean Water Cycle Diagram
- Ocean Water Chemistry
- Movement of Ocean Water
- Ocean Water Cycle
- Properties of Ocean Water
- Desalination of Ocean Water
- Ocean Water Purification
- Ocean Water Salty
- Ocean Water Pollution
- Ocean Water Pressure
- Composition of Ocean Water
- Water Pollution Ocean Debris


