Curated OER
Grade 2: Spinning Sums
Second graders collect data by spinning two spinners and creating sums, organize the data, and make conclusions from the data. Each students makes a spinner. They spin and record the number of the section each time. Students work in...
Curated OER
Weathering Rates
Students calculate weathering rates from tombstone weathering data. Atmospheric (and precipitation) chemistry determines the rate of weathering for marble tombstones. They are shown data from a rural and an unrban cemetery, and are...
Curated OER
How Much Will I Spend On Gas?
Students construct a linear graph. In this graphing lesson, students determine a monthly budget for gasoline. Students construct a t-chart and coordinate graph to display data. Resources are provided.
Curated OER
Jazz and Math: The Beat Goes On
Learners collect real data through listening, counting and timing jazz pieces.They use ratios, rates, and proportions to report collected data and demonstrate an understanding of the concepts of rhythm and tempo in music.
Curated OER
Ocean Botttom Profile
Learners interpret a graph of ocean depths and topographic features. This task assesses students' abilities to interpret figures, organize and represent data, apply knowledge of scale to a profile, and apply theoretical knowledge.
Curated OER
Geometric Probablitiy: Spinners and Dartboards
Sstudents explore and analyze the properties of geometric areas. In this geometry lesson, sstudents use technology to simulate spinners and dartboards in order to fing areas of circles and sectors of circles and compare and...
Curated OER
Boxplots Introduction
Young scholars describe the pattern of a bell curve graph. In this statistics lesson, students move data around and make observation about the mean, and the quartiles. They define boxplot, outlier, range and other important vocabulary...
Curated OER
Seed Growth
Students develop an independent procedure to investigate the germination of two types of seeds. Students must construct data tables or charts to record observations and results, graph the data, and analyze the data.
Curated OER
Mystery Paint
Students use the scientific method to determine the properties of various kinds of paints, use collected data to identify paint samples that are not properly labeled and use proper science safety techniques while working with chemical...
Curated OER
A Thanksgiving Survey
Young scholars take a survey then use the information gained from the survey to help plan a typical Thanksgiving dinner for our last day of class. They create a graph which corresponds the the data gathered during interviews.
Curated OER
Making Connections
Eighth graders investigate the input/output model for building function tables. From the data, 8th graders connect tables, graphs, function rules, and equations in one variable. They work backwards to determine function rules for given...
Curated OER
Rockets: Kinematics or Energy?
Students construct model rockets, measure and record the height of the launch. In this creative lesson students use different methods to calculate velocity and height data from their launched rockets.
Kenan Fellows
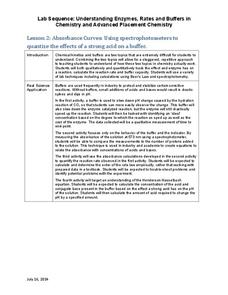
Absorbance Curves: Using Spectrophotometers to Quantize the Effects of a Strong Acid on a Buffer
The Henderson-Hasselbalch equation combined logarithmic terms with the application of carbonic acid as a buffer solution. Scholars learn investigate equation and its applications through hands-on experiments. They collect data and...
Pingry School
Determination of the Molar Mass of an Unknown Acid
Acids and bases have a love-hate relationship. They balance each other so nicely, but they are complete opposites! Learners use these concepts and titration to calculate the molar mass of an unknown substance. The experiment...
Curated OER
Hot Rocks
Students demonstrate that setting of plaster and cement is a change, which involves a release of heat energy, use data collected experimentally to construct comparison graphs and analyze the graphs to make predictions about future...
Federal Reserve Bank
Monetary and Fiscal Policy in Times of Crisis
Following the 2008 financial crisis in the United States, why did fiscal policymakers increase government spending and reduce taxes? Discover the motivation behind these actions and learn about the separate functions of monetary and...
Howard County Schools
Planning for Prom
Make the most of your prom—with math! Pupils write and use a quadratic model to determine the optimal price of prom tickets. After determining the costs associated with the event, learners use a graph to analyze the break even point(s).
Kenan Fellows
Reaction Stoichiometry—How Can We Make Chalk?
What is a reasonable percent yield in the manufacturing process? Scholars develop a process for producing chalk in the third lesson of a six-part series. Then, they must determine the theoretical and percent yield. Discussions about...
Curated OER
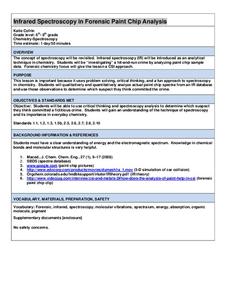
Infrared Spectroscopy in Forensic Chip Analysis
Students analyze spectrums as related to forensics. In this chemistry lesson, students define spectroscopy and discuss its use in chemistry. They discuss how the Forensic Paint Chip is used to help solve crimes.
Curated OER
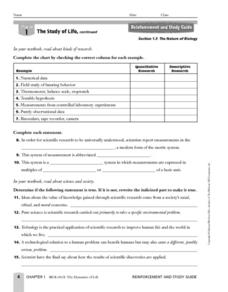
The Study of Life
In this scientific research worksheet, students will complete a chart by determining if the statements given are examples of quantitative research or descriptive research. Then students will fill in the blank of 8 statements about the...
Curated OER
Pizza Topping Combinations
Learners brainstorm pizza toppings and determine the number of possible ways to order a pizza. In this algebra lesson, students analyze and investigate geometric patterns as they relate to the concept of a variable. Learners then...
Curated OER
A Focus on Mechanical Friction
Students explore mechanical friction. They perform experiments to observe the direction of mechanical motion and the difference between rolling and sliding friction. Data results on the experiments are recorded and students answer...
Curated OER
Christmas Presents
Seventh graders create a graph of their Christmas gifts. They develop categories, compute fractional and decimal parts for each category, identify the number of degrees to represent each fractional part, and create a circle graph to...
Curated OER
ESL Pre-Intermediate Grammar Worksheet- Quantifiers and Indefinite Articles
In this ESL grammar worksheet, students fill in the blanks in 12 sentences with the proper quantifier or indefinite article. They choose the appropriate word from a word bank that is located above the sentences.


