Curated OER
An Introduction to Data Reading and Computations
Students discover data reading and computations. In this math lesson plan, students collect nutritional data about intakes of certain foods compared with daily recommended allowances. Students create their own data charts based on their...
Curated OER
Tally Charts
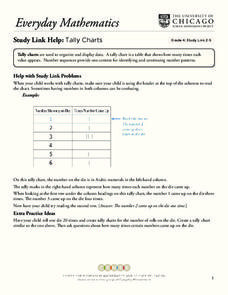
In this tally charts worksheet, students discuss how to use a tally chart and how to read the chart. Once students record information on a tally chart they answer questions showing their ability to read a tally chart.
Curated OER
A Nation of Nations Lesson Plan: Charting African Ethnicities in America
Students read a portion of the narrative, The Transatlantic Slave Trade, to explain the ethnic origins of enslaved Africans brought to the US. They create charts and bar graphs comparing ethnicities in the lowlands and tidewater regions.
Curated OER
Chart problems involving car defects and customer service departments
In this interactive activity, learners solve two problems using the charts provided. Students must convey they are able to understand charts and how to read them.
Curated OER
Statistics: Reading and interpreting production graphs
Students interpret and create different types of graphs. They analyze data from charts, develop a survey and design appropriate graphic illustrations and make a presentation.
Curated OER
Charting Animal Life Spans
Second graders research animal life spans and complete related math activities. In this life span lesson, 2nd graders read How Many Candles and discuss life spans. Students arrange animal cards based on their life spans. Students find...
Curated OER
Types of Data
In this data chart worksheet, students read the directions and study the examples to learn the difference between qualitative, quantitative, discrete and continuous data. Students answer 24 questions. This page is intended to be an...
Curated OER
Using A Table
In this table worksheet, middle schoolers observe information in a table, and then answer ten questions pertaining to the information. They must correctly read a table in order to arrive at the correct answer. Questions pertain to...
Curated OER
Weather Calendar
In this weather calendar worksheet, students read the calendar and identify the type of weather that occurred on that date. They also determine the total number of days that were cloudy, sunny, etc. There are 9 questions on this...
Curated OER
Country Locations
First graders read a story and locate where the countries in the story are located. In this traditions lesson, 1st graders explore food dishes from different countries and discuss where they are located. Students tell their favorite...
Curated OER
Graphing Family Reading Habits
Second graders collect data from their families about their reading habits and graph them. In this graphing family reading habits lesson, 2nd graders interview family members about their reading habits. They then use a graphing computer...
Curated OER
Creating Pie Graphs Using Percents
Sixth graders examine how to convert fractions to percents and percents to fractions. They list their activities for a 24 hour period, and create a pie graph using Microsoft Works.
Curated OER
Who Represents You?
Students investigate Congress and how individuals are represented in this Country. In this government instructional activity, students complete worksheets research government web sites to determine which senators and congressmen...
Curated OER
Adding Mixed Numbers 1
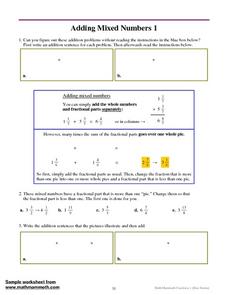
In this adding mixed numbers worksheet, students write addition sentences using pie charts, add mixed numbers with the same denominator, and write mixed numbers as fractions in simplest form. Students solve nine problems.
Curated OER
My Test Book: Tally Charts
In this online interactive math worksheet, students solve 10 problems that require them to read and interpret tally chart data. Students may submit their answers to be scored.
Curated OER
Lesson 3 How Do You Read Stock Quotes Online ?
Students understand how to get and interpret stock price data online. They describe certain aspects of various corporations and know the meanings of important terms involving the stock market.
Curated OER
Create a Graph Online
Scholars create colorful bar, line, or pie graphs. They decide on a survey question to ask or a type of data to gather. From there, they collect information and data. They display this data in bar, line, or pie graphs that they create...
Curated OER
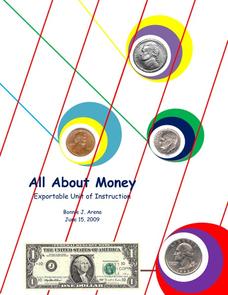
All About Money
Few topics engage young mathematicians as much as learning about money. Through a series of shared readings and hands-on activities, children explore the US currency system, learning how to count money and calculate change as they create...
Curated OER
Valentine's Day Ordering and Comparing
After a lesson on tables and charts, students can practice their data-reading skills by comparing how many Valentine's cards Heather received and gave out over the last few years. Additionally, students can practice their "greater than"...
Curated OER
Jim, Tony, and Frank-The School Fund-raiser (Graphing)
In this graphing worksheet, students view a pie chart. Students use their graphing knowledge to interpret the pie chart and answer ten questions. There is an answer sheet.
Curated OER
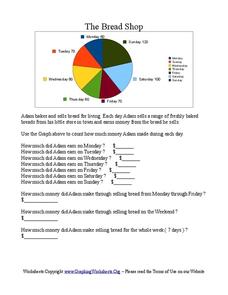
The Bread Shop
For this pie chart worksheet, students use the pie chart graph to count the money Adam made in the Bread Shop. Students complete 10 questions.
Curated OER
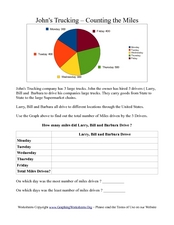
John's Trucking- Counting the Miles
In this graphs worksheet, students analyze a pie graph showing miles driven by three truck drivers in a week. Students fill out a chart in which they calculate total miles driven.
Curated OER
CHARTING THE COURSE
Students uses atlases, maps, and Web resources to determine the distance, driving time, and amount of money they need to make the trip (estimates should include hotel/motel stays, meals, and souvenirs).
Curated OER
Winter Insulation
Students test insulation materials. In this energy conservation lesson, students use different insulation materials to see which one holds heat the best. Students pour hot water into bottles, take the temperature, wait 15 minutes, then...
Other popular searches
- Reading Charts and Graphs
- Active Reading Charts
- Kwl Charts and Reading
- Reading Charts and Diagrams
- Kl Charts and Reading
- Reading Charts and Tables
- Criteria Charts in Reading
- Reading Charts or Diagrams
- Plot Charts for Reading
- Data Charts Reading
- Reading Charts Wind
- Math Reading Charts


