Education World
The African American Population in US History
How has the African American population changed over the years? Learners use charts, statistical data, and maps to see how populations in African American communities have changed since the 1860s. Activity modifications are included to...
Curated OER
Twelve Days of Christmas--Prediction, Estimation, Addition, Table and Chart
Scholars explore graphing. They will listen to and sing "The Twelve Days of Christmas" and estimate how many gifts were mentioned in the song. Then complete a data chart representing each gift given in the song. They also construct...
Alabama Learning Exchange
Yummy Apples!
Young learners listen to a read aloud of Gail Gibbons book, Apples and the story A Red House With No Windows and No Doors. They compare characteristics of a number of kinds of apples, graph them and create a apple print picture. Learners...
Curated OER
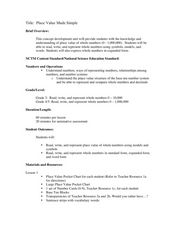
Place Value Made Simple
Elementary schoolers explore place value to the millions place. They construct and evaluate the value of numbers. Working in small groups, pupils problem solve with pocket place value charts, and examine standard and expanded forms. This...
Primary National Strategy
Ordering and Counting
Are you in need of a 5-day unit intended to teach little learners how to count to 20? This is a well-structured complete set of lessons which employ a variety of methods to instruct learners about various ways to count from 1 to 20. They...
Curated OER
Measures
Estimate and explore the length and weight of classroom items using standard measurement and scales. Students will work in groups to determine appropriate measuring tools, weigh or measure items, and record their results on a data chart....
Mathed Up!
Negative Numbers
Individuals read tables with temperatures and times in order to distinguish the town with the lowest temperature or most extreme temperature difference. Each of the eight questions has three sub-questions that use the same charts.
Curated OER
Study Buddies: Adding Two-Digit Numbers
Some times a simple lesson plan is all you need. Here are 2 worksheets that can be used as a lesson plan on problem solving, addition, and partner work. The first worksheet has learners use a tens and ones charts to practice adding...
Curated OER
Rhythm, Math, Rhythm
Students play instruments in math class to learn the interconnectedness between math and music. In this math lesson, students subdivide a piece of music, clapping rhythms and charting rhythm patterns in the song. A guided discussion...
Curated OER
Getting Graphs: Researching Genealogy-A Piece of Pie
Third graders research their genealogy. In this math lesson, 3rd graders collect data and create graphs and charts. A presentation of their findings is given.
Curated OER
Investigating: Interpreting Graphs and Analyzing Data
Students explore statistics by researching class birthday data. In this data analysis lesson, students investigate the different birthdays among their classmates and create data tables based on the given information. Students view bar...
Curated OER
Brain Booster
In this counting money worksheet, students read the chart listing the food items and their prices. Students then solve the two questions using the chart and counting the money to find the answers.
Curated OER
Collecting Data
In this data collection instructional activity, learners read about how data is collected and organized. They also learn about a hypothesis. Students read through examples of different charts and then answer 23 questions pertaining to...
Curated OER
Reading Graphs
Learners read graphs and charts to interpret results. In this algebra activity, students interpret bar, line and pictographs. They draw conclusions and make predicitons based on these charts.
Curated OER
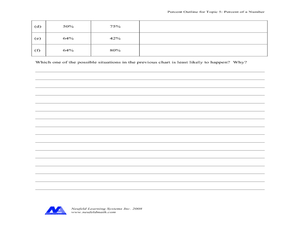
Percent of a Number
In this percent worksheet, students complete problems such as changing percents to decimals, filling in percentage charts, and more. Students complete 8 problems.
Curated OER
Finding Sums to 6
Students explore the additive identity property where they add multiple numbers to get to the number 6. For this number 6 lesson plan, students also work on their addition charts.
Curated OER
What Time Is It?
Fourth graders distinguish between analog and digital clocks and read time from both types. In this clock reading instructional activity, 4th graders discuss the types of clocks and the time zones. Students find times in specific time...
Curated OER
Circle Graphs
In this circle graphs worksheet, students solve 10 different problems that include reading various circle graphs. First, they use graph 1 to determine how many students preferred which sport. Then, students use graph 2 to determine the...
Curated OER
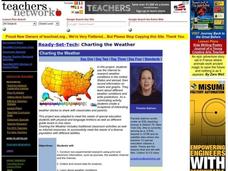
Charting the Weather
Students research and conduct non-experimental research, such as journals, the weather channel and the internet, to collect and record data for analysis on weather conditions in the United States and abroad. They identify, pronounce and...
Curated OER
Fruit Shopping
In this fruit shopping worksheet, students are given pictures of various fruits to put in the shopping bags. Students read and interpret the given chart to know the correct amount of each fruit.
Curated OER
Make a Tally
In this tally chart learning exercise, students read the word problems and use the information within the problem to make a tally chart. Students use the tally charts to help them finish and solve the word problem.
Math Worksheets Land
Pie or Circle Graphs - Matching Worksheet
It's one thing to be able to read a pie graph, but it's another to analyze a pie graph and match it to its data table. Use a multiple choice worksheet when challenging learners to practice this skill. With six data charts and pie graphs,...
Beyond Benign
Plastic Bags
Paper or plastic? Explore the environmental effects of using plastic bags through mathematics. Learners manipulate worldwide data on plastic bag consumption to draw conclusions.
Other popular searches
- Reading Charts and Graphs
- Active Reading Charts
- Kwl Charts and Reading
- Reading Charts and Diagrams
- Kl Charts and Reading
- Reading Charts and Tables
- Criteria Charts in Reading
- Reading Charts or Diagrams
- Plot Charts for Reading
- Data Charts Reading
- Reading Charts Wind
- Math Reading Charts


