Curated OER
Graphic Organizers
Students complete graphic organizers. In this graphic organizer lesson plan, students fill out various graphic organizers in order to better understand a comprehension skill. Eighteen graphic organizers are included.
Curated OER
Building a Scale Model
Third graders create a model of the solar system. In this solar system lesson, 3rd graders create a scale model of the solar system. Working in pairs students solve mathematical problems to correctly measure the distance each planet is...
Curated OER
How Does Your Garden Grow?
Students complete activities to learn about the life cycle of a seed. In this plant growth lesson, students complete activities for the life cycles of seeds.
Curated OER
Ecuadorian Rainforest: If the Forests Could Talk
Third graders explore the delicate balance the must be maintained in a rainforest ecosystem. In this ecosystems lesson, 3rd graders learn about the importance of "little things" such as bugs or a certain plant in the rainforest. This...
Curated OER
A Thanksgiving Feast
Learners compare a Thanksgiving feast of today to the Thanksgiving feast of 1621. They analyze information to write a Rebus story about a Thanksgiving feast of today of the Thanksgiving feast of 1621. Pupils describe a typical...
Curated OER
Away We Go!
Students study types of transportation. In this transportation lesson, students survey several classes to gather data on how they get to school. Students create a transportation graph.
Curated OER
Interpreting a Flowchart
Students examine insects place in a community. They discover the communities of insects.
Curated OER
A Look at the Life That Electronics Lead
In this comprehension worksheet, students fill in ways on a graphic organizer that people or companies can conserve energy, reduce waste or minimize the impact to the environment. Next, students solve 3 "environmental" math word problems.
Curated OER
The Research Paper - Searching for a Subject
Students research a website to look for potential topics for a research paper. They develop a narrowed prioritized subject list on an index card (3X5) using word processing program.
Curated OER
Colors/colors
Students make a prediction/hypothesis based on what you currently know about "mixed messages".
Curated OER
De Vacaciones en Bariloche
Students answer simple questions that do not require much analysis. They answer true/false questions. Students answer multiple choice which would be the best meaning of this word. They use graphic organizers to contrast a cheap vs, a...
Curated OER
Scavenger Hunt
Students search for items in various parts of the newspaper noting the different types of information it provides.
Grammarly
Grammarly Handbook: Visuals: Graphs, Charts, and Diagrams
This article explains that graphs, charts, and diagrams are used to display information visually. The choice of what type of graph or chart to use depends on the information to be displayed. Software programs make these much easier to...
Read Works
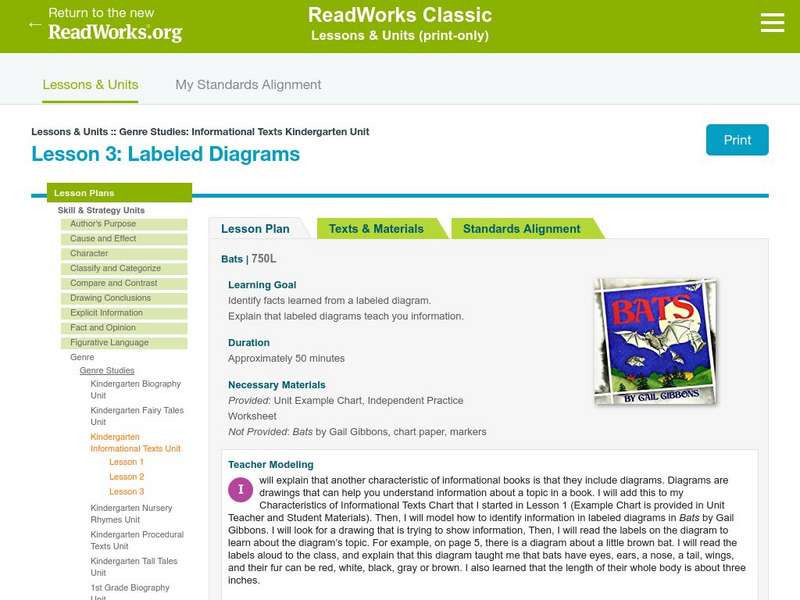
Read Works: Genre Studies: Informational Text Kindergarten Unit: Labeled Diagrams
[Free Registration/Login Required] Lesson uses Bats by Gail Gibbons to teach students how to identify facts learned from labeled diagrams within an informational text. Ideas for direct teaching, guided practice, and independent practice...
Other
Reading Quest: Making Sense of Social Studies
Teaching students to read well in areas other than language arts requires teaching and reinforcing the kinds of reading strategies taught here. There are 27 strategies, ranging from brainstorming to word mapping. The site includes PDF...
CK-12 Foundation
Ck 12: Elem Math: Using Real Maps English Lengths and Distances
[Free Registration/Login may be required to access all resource tools.] The video describes how to use a map to answer questions using the lengths provided in the diagram.
Daily Teaching Tools
Daily Teaching Tools:more Graphic Organizers for Teaching Literature and Reading
This Daily Teaching Tools collection provides graphic organizers for teaching reading and literature. Elaborate graphic organizers are provided for the following: story maps, character study charts, making text connection maps, conflict...
Florida Center for Reading Research
Florida Center for Reading Research: Exp. Text Structure: Text Feature Find
A lesson plan in which students look through a book to find various text features including: a table of contents, sequence and format, charts/graphs/maps, diagrams/graphics/illustrations, print variations, an index, and a glossary....
Texas A&M University
Wtamu Virtual Math Lab: Beginning Algebra: Reading Graphs
A good introduction to reading bar, line, and double line graphs, and drawing and reading Venn diagrams. Contains definitions and examples of these types of charts and graphs as well as practice exercises that ask you to answer questions...
University of Cambridge
University of Cambridge: Nrich: Alphabet Blocks
Help Santa and the elves keep track of how many blocks they need for their alphabet blocks. Solution provided.
University of Cambridge
University of Cambridge: Nrich: Creating Cubes
On this one page website use a table to help you organize the information so that you can solve this cube problem. When you are finished you can check your answer right at the website.
University of Cambridge
University of Cambridge: Nrich: The Lily Pond
Using your problem solving skills find the best way for Freddie to visit Sammy. On this one page website the solution is right there for you when you have found a solution.
University of Cambridge
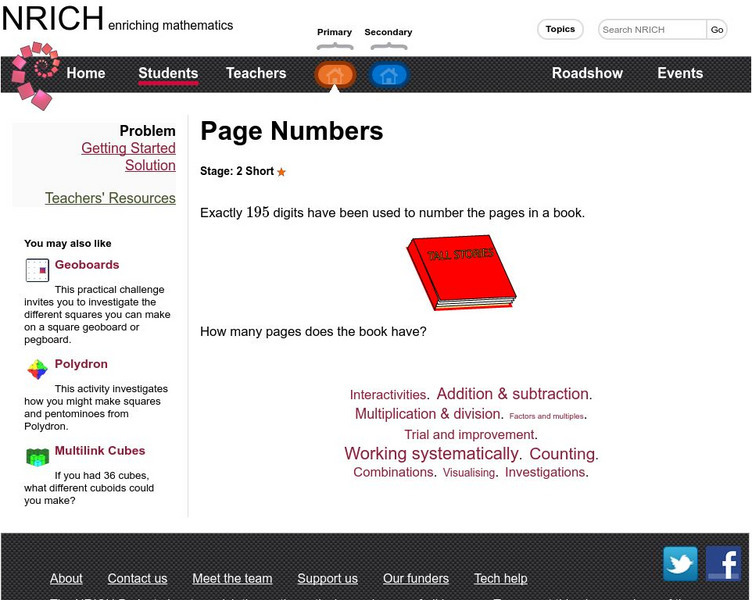
University of Cambridge: Nrich: Page Numbers
Exactly 195 digits have been used to number the pages in a book. How many pages does the book have? Sounds simple enough--if you have the right problem-solving skills. Solution provided.


