Concord Consortium
Broken Spreadsheet I
There is power in spreadsheet formulas and learners use this power to model quadratic data. Given a scatterplot of a parabola, pupils create formulas in a spreadsheet to populate the data. The formulas they use lead to an understanding...
Pingry School
The Water Lab – Spreadsheet Simulation
More than 70 percent of people and 90 percent of businesses use spreadsheets regularly. While many courses overlook the important skill, the simple water lab focuses on entering spreadsheet data, formatting it, and printing plots based...
Concord Consortium
Broken Spreadsheet II
Work in reverse with the product becoming the given. Using a spreadsheet image of the graph of a trigonometric function, young scholars investigate methods of creating spreadsheet data that results in the given graph. The catch? The data...
Curated OER
Analyzing Discrete and Continuous Data in a Spreadsheet
You are what you eat! Your statisticians keep a log of what they eat from anywhere between a day to more than a week, keeping track of a variety of nutritional information using a spreadsheet. After analyzing their own data, individuals...
Curated OER
Pancake Breakfast Plans
In this pancake breakfast planning worksheet, 5th graders solve and complete 9 different problems that include completing a chart for a pancake breakfast. First, they set up a spreadsheet to help them plan the event. Then, students...
Concord Consortium
Boards II
Build spreadsheet skills while investigating decimal multiplication. An open-ended task asks learners to edit a spreadsheet to create a multiplication table for decimals. Provided with a specific interval, pupils create formulas that...
Curated OER
High Temperature records by State
In this temperatures instructional activity, students view a spreadsheet of the high temperatures of the states and change the data on it using spreadsheet tools. Students complete 4 tasks.
Curated OER
Lunch Menu Calories tracking project
In this lunch menu learning exercise, learners make a spreadsheet where they count the calories of different food items on the lunch menu, chart their findings, and answer short answer questions. Students answer 5 questions.
Curated OER
Endangered Species
In this geography learning exercise, students identify how to manipulate data on a range of endangered species. They create a bar graph of endangered animals from Africa, Asia, Australia, North America, or South America. Students use a...
Curated OER
Spreadsheet Page 2
In this technology worksheet, students examine the definitions. The words are used in order to match the them with the bullet points.
Concord Consortium
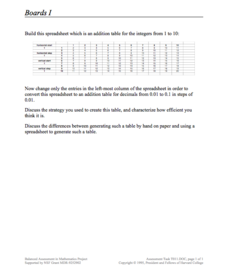
Boards I
Learners create patterns in a table to mimic the function of an electronic spreadsheet. The result is a table that creates an addition table for decimals in intervals of one-tenth. While creating the pattern, pupils must thoroughly...
Concord Consortium
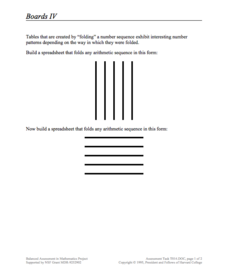
Boards IV
Build a connection between algebraic sequences and spreadsheets. Learners examine a specific folding pattern and convert the pattern into a spreadsheet. The goal of the spreadsheet is to produce a sequence of a specific pattern modeled...
Concord Consortium
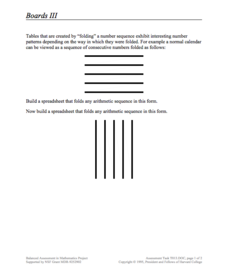
Boards III
Learn to visualize mathematical patterns as a folded pattern. Beginning with a visual display, the task encourages pupils to view sequences as a folded table. The pattern of the table then becomes a formula in a spreadsheet that...
Concord Consortium
Center of Population
Let the resource take center stage in a lesson on population density. Scholars use provided historical data on the center of the US population to see how it shifted over time. They plot the data on a spreadsheet to look the speed of its...
Curated OER
Measuring and Observing Weather Phenomena
In this weather worksheet, students take the temperature and record data over a period of time of 1 month. Students then make a spreadsheet of their data and include variables that contribute to the weather.
Google
The Law of Large Numbers and Probability
Learners investigate why theoretical probability doesn't always match reality. The activity involves using Python 2.7 (or Sage) to set up a Bernoulli Trial. It also involves setting up a spreadsheet to simulate the Birthday Paradox....
Yummy Math
Parametric Equations and a Heart
Trigonometry, art, and Valentine's Day come together in a creative activity about parametric equations. Learners calculate several equations before graphing them either by hand, on a graphic calculator, or Excel spreadsheet to curve...
Curated OER
A Problem in Satellite Synchrony
In this satellite synchrony worksheet, students use a spreadsheet or Least Common Multiples to solve 4 problems related to the satellite orbits, orbital periods and their synchronicity. Students determine when the satellites launched in...
NASA
Space Shuttle Ascent: Mass vs. Time
Set the stage for groups of rocket scientists to explore the change in mass of the space shuttle during ascent. Teams work together to graph actual launch data in order to determine the rate of propellent burn.
Curated OER
A Mathematical Model of the Sun
In this mathematical model of the sun worksheet, students read about the way scientists use the sun's radius and mass to determine a mathematical model of the sun using the volume of a sphere, and the relationship between density, volume...
NASA
The Effects of Sunspots on Climate
In this sunspots and climate change learning exercise, learners use a diagram of a tree stump and its rings to determine the age of the tree. They use sunspot data from the internet and they construct an Excel spreadsheet to compare the...
Curated OER
What's Alike, What's Different Worksheet
For this occupations worksheet, students create a spreadsheet by answering the 3 short answer questions in order to find similarities and differences among occupations.
Curated OER
Buying My First Car Worksheet 3
In this math worksheet, students create a spreadsheet for the different costs of the purchase of a car and use the information to answer 3 questions.
Statistics Education Web
Are Female Hurricanes Deadlier than Male Hurricanes?
The battle of the sexes? Scholars first examine data on hurricane-related deaths and create graphical displays. They then use the data and displays to consider whether hurricanes with female names result in more deaths than hurricanes...
Other popular searches
- Spreadsheets
- Excel Spreadsheets
- Budget Spreadsheet
- Favorite Foods Spreadsheet
- Microsoft Excel Spreadsheets
- Candy Wrapper Spreadsheet
- Basic Spreadsheet Skills
- Spreadsheet Lesson Plans
- Meteorology and Spreadsheets
- Using Excel Spreadsheets
- Amusement Park Spreadsheet
- Creating a Spreadsheet


