Hi, what do you want to do?
American Psychological Association
A Tasty Sample(r): Teaching about Sampling Using M&M’s
Here's a sweet activity! As part of a study of psychological research methods and statistic gathering, individuals develop a hypothesis about the number of each color of M&Ms in a fun-size package. They then count the number of each...
Stats Monkey
Everything I Ever Needed to Learn about AP Statistics I Learned from a Bag of M and M's®
Candy is always a good motivator! Use this collection of M&M's® experiments to introduce statistics topics, including mean, standard deviation, nonlinear transformation, and many more. The use of a hands-on model with...
Fort Bend Independent School District
Data Analysis - AP Statistics
What better way to study survey design than to design your own survey! Bring a versatile data analysis project to your AP Statistics class, and encourage them to apply the practices from their instructions to a real-world survey...
Illustrative Mathematics
Why Randomize?
Your statisticians draw several samplings from the same data set, some randomized and some not, and consider the distribution of the sample means of the two different types of samplings. The exercise demonstrates that non-random samples...
Curated OER
School Advisory Panel
How would you choose three high schoolers from your class to be on a school panel that would represent a fair and representative view of opinions? This brief activity offers four different sampling methods to choose from and asks...
Texas Instruments
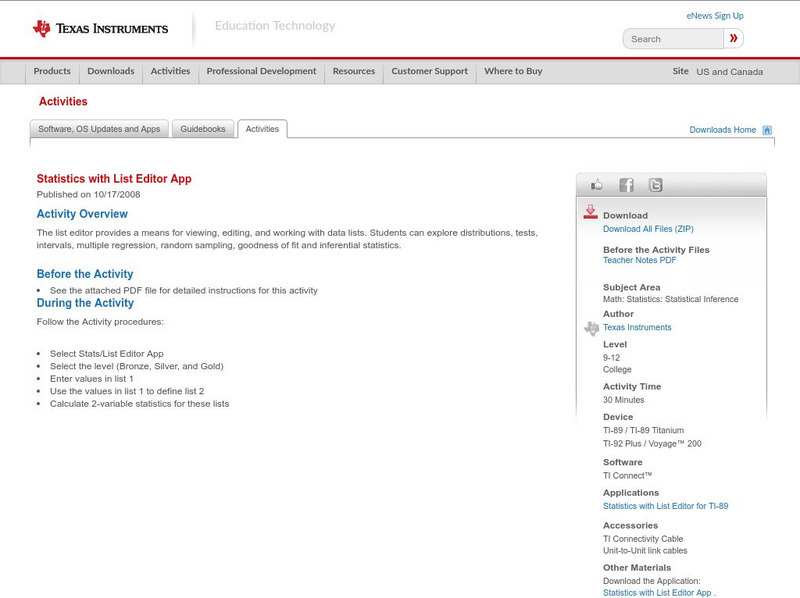
Texas Instruments: Statistics With List Editor App
The list editor provides a means for viewing, editing, and working with data lists. Students can explore distributions, tests, intervals, multiple regression, random sampling, goodness of fit and inferential statistics.
Texas Instruments
Texas Instruments: Statistics Pretest
This is a pre-test for a statistics class. Since most systems want data driven analysis, this is a great way to get data at the beginning of the course on how much students know about statistics.
Texas Instruments
Texas Instruments: Inferences of the Least Squares Regression
This set contains questions regarding inference for the slope of the least-squares linear regression line. The student learns to develop hypotheses, find the test statistic, and reach a conclusion in the context of the original problem.
Texas Instruments
Texas Instruments: Type I and Type Ii Errors
This set contains questions regarding Type I and Type II errors, and the power of an inference test. Students differentiate between Type I and Type II errors, and their relationship to the null and alternative hypotheses.
Texas Instruments
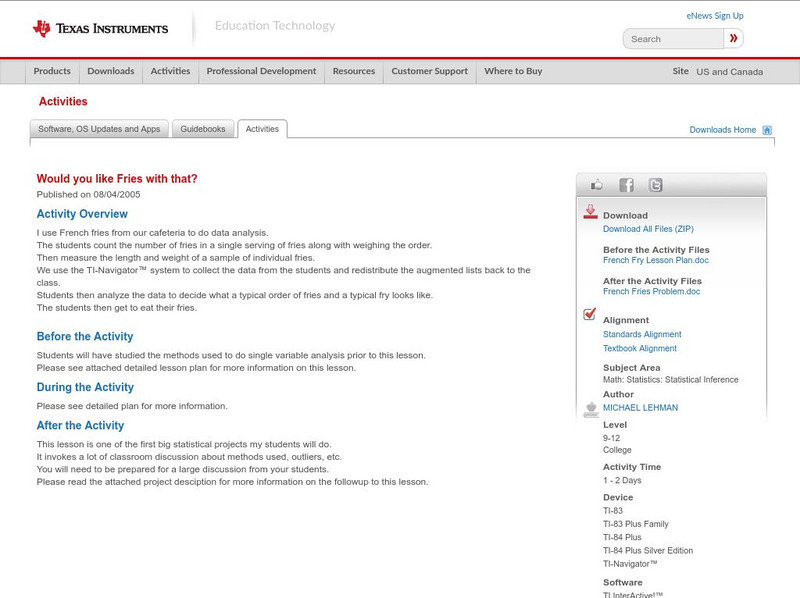
Texas Instruments: Would You Like Fries With That?
French fries from your cafeteria to do data analysis. The students count the number of fries in a single serving of fries along with weighing the order, then measure the length and weight of a sample of individual fries. You then use the...
Texas Instruments
Texas Instruments: Assumptions and Conditions for Significance/hypoth
These questions cover the criteria for inference tests: "conditions," when the actual data is given, and "assumptions," when the data is missing and only summary statistics are given.
Texas Instruments
Texas Instruments: Special Cases of Normally Distributed Data
Students perform single and two-sample t procedures to investigate special cases of normally distributed data. They explore inference for a least-square regression line, including the confidence interval.
Texas Instruments
Texas Instruments: Weather Study With Ti Interactive
Students will extract weather data from the web for several major cities. They will then display and discuss the data.
Texas Instruments
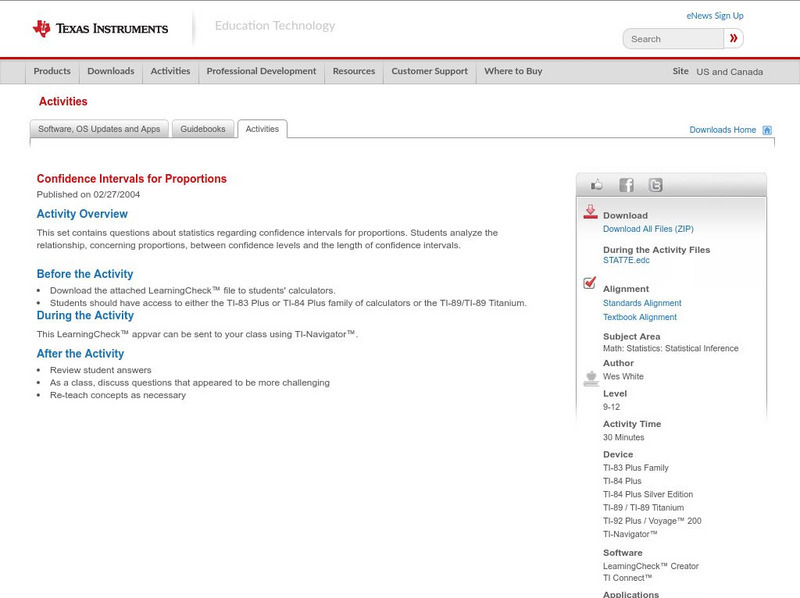
Texas Instruments: Confidence Intervals for Proportions
The student will use the TI-83 Plus/TI-84 Plus to calculate confidence intervals for proportions.


