Curated OER
Chapter 15 Review, Section 2: Acid-Base Titration and pH
Keep it simple with this chemistry assignment. Learners examine an acid-base titration graph and answer four questions about the data. Then they will balance neutralization equations and calculate molarity for several specific solutions....
Curated OER
Chemistry Midterm Practice Exam
A comprehensive practice exam, this resource covers many areas of chemistry. The test includes 71 multiple choice questions on topics such as problem solving, chemical equations, chemical formulas, thermodynamics, acids and bases, and...
Curated OER
Chemistry 142 Exam 1
For this chemistry exam worksheet, students solve fifteen problems related to acids and bases, rates of reactions, and half life.
Curated OER
Regents High School Examination PHYSICAL SETTING CHEMISTRY 2007
The University of the State of New York has designed a series of exams to be given to high schoolers. This chemistry exam is one of the most comprehensive and well-written that you will ever find. It consists of 84 questions in a variety...
Curated OER
pH Curves and Indicators
Glimpse how pH changes during an acid-base titration by examining graphs. It contains not only graphs of pH changes, but also a chart summarizing what indicator to choose for different changes. This is not truly a worksheet, but an...
Curated OER
Acid-base Homework Problem Set 2
In this acid-base reaction worksheet, students calculate the ion concentration and pH for 6 solutions, graph titration results for 11 reactions and use Henderson-Hasselbach equations for three problems.
Curated OER
Thermometric Titration Involving Dataloggers
In this thermometric titration instructional activity, students determine the concentrations of hydrochloric acid and ethanoic acid using a titration where they measure the temperature of the solution as they titrate. The equivalence...
Education Development Center
Points, Slopes, and Lines
Before graphing and finding distances, learners investigate the coordinate plane and look at patterns related to plotted points. Points are plotted and the goal is to look at the horizontal and vertical distances between coordinates and...
Curated OER
The Biogeochemical Cycles
The majority of this presentation is a collection of diagrams and graphs that back your lecture on biogeochemical cycles. The last few slides define ecosystems and the Gaia hypothesis. You may find these slides valuable, but will...
Curated OER
Cell Respiration Worksheet
Beginning biologists demonstrate their grasp on cellular respiration, photosynthesis, and energy flow though ecosystems when completing this worksheet. Fifteen multiple choice and short answer questions test their knowledge. Because of...
Simon Fraser University
Chem1 Virtual Textbook: Titration Curve
Acting as an overview from the General Chemistry Virtual Textbook, this site acts as one in a series of slides on acid-base systems. This particular slide deals with the titration curve in graphing of acetic acids.
Simon Fraser University
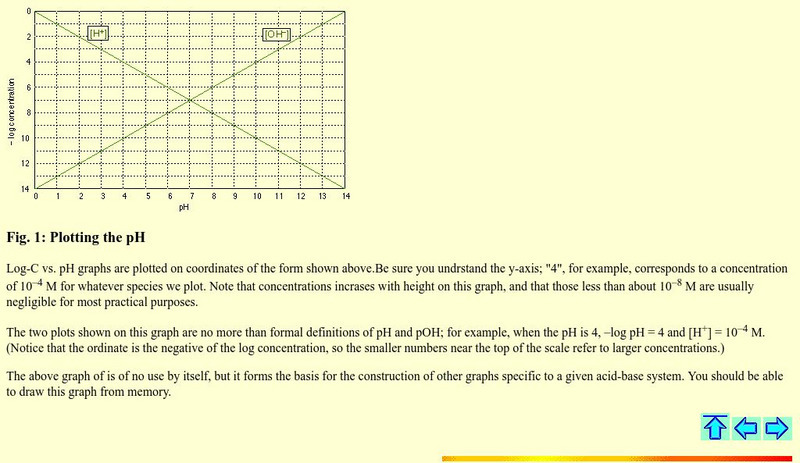
Chem1 Virtual Textbook: Plotting the P H
Acting as an overview from the General Chemistry Virtual Textbook, this site acts as one in a series of slides on acid-base systems. This particular slide deals with coordinating pH graphs.


