Curated OER
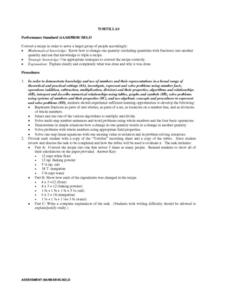
Tortillas
Students convert recipes for tortillas. They calculate the amounts of ingredients as they convert recipes and write an explanation of the task to demonstrate their calculations. After reviewing their calculations, they demonstrate how...
Curated OER
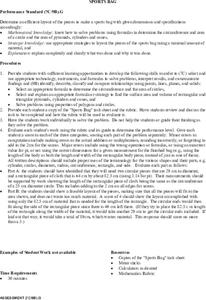
Sports Bag
Students determine an efficient layout of the pattern pieces needed to make a sports bag with given dimensions and specifications. Given a word problem, data set and a diagram, students evaluate the information they have available and...
Curated OER
Menu Math
Pupils follow the food pyramid to create a daily food budget. They research food prices online or in newspapers. They graph the amount of each food group included in their menus. They can also create a weekly food menu based on a fixed...
Curated OER
Jelly Belly: What a Wonderful "Bean"!
Young scholars explore how jelly beans are produced. They discuss the origins of the jelly bean and view a video about how jelly beans are prepared, tested, shaped, finished, and shipped and estimate the amount of jelly beans in a jar...
Curated OER
Optical Illusions
Students investigate optical illusions. In this optical illusions lesson, students explore perception. Students analyze optical illusions and determine common misconceptions.
Curated OER
The Ice Cream Shop
Second graders read books about ice cream and plan an ice cream sundae party for the class. They research ingredients and determine how much the party cost each student. They hold a mock opening for an ice cream store and have their party.
Curated OER
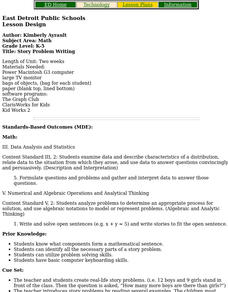
Story Problem Writing
Students write story problems which can only be solved with the application of multiplication facts. They write an extra fact that isn't needed to solve. When their partners do the problems, they must cross out the fact that they do need.
Curated OER
Linear and Exponential Growth
Pupils explore the concept of linear and exponential growth. In this linear and exponential growth lesson, students collect data about China's population. Pupils model the data to determine if it is linear or exponential.
Curated OER
Punch Mix-up
Fifth graders discuss the relationship between equivalent fractions, ratios, and proportions. In this fraction activity, 5th graders answer questions about a punch mixture in order to find the ratio of ingredients.
Curated OER
Multiplication and Division Drills
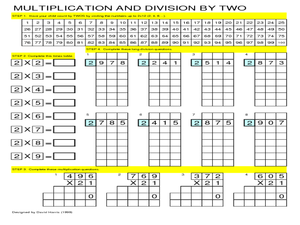
In this multiplication activity, students complete multiplication problems including numbers up to 3 digits. Students complete 16 problems total.
Curated OER
Graphing Linear Equations
Students graph linear equations. In this algebra lesson, students investigate the price of tolls in different states and create a graph. They analyze their graph and draw conclusions.
Curated OER
Little Magic Squares
Students and teacher talk about arrays of numbers like the ones in A Square of Circles. They check to see that the rows all have the same sum; that the columns all have the same sum; and that the diagonals have the same sum.
Curated OER
Late-In-The-Year Counting
Students practice forward and backward counting. In this counting instructional activity, students calculate how many objects in a bag by counting forward and then count backward to check.
Curated OER
Block Breakers
Students throw bean bags at stacks of blocks. They record the results and write the corresponding mathematical equations.
Curated OER
Math & Social Science
Students are given data and are to calculate averages and yearly totals of how many cars travel the Tacoma Narrows Bridge. They also make a graph of the data.


