Curated OER
Populations – The Survival of the Fittest (Part 1)
Students explain in their own words why organisms live together. In this biology lesson, students model what happens to organisms if their environment changes. They explain the importance of evolution.
Curated OER
Welcome to Populations!
Students define what population is in their own words. In this biology lesson, students explain different ways to measure population density. They interpret population graphs.
Curated OER
The World Population Explosion
Students are introduced to some of the fundamental questions about the connections among population, resources and energy use, and environmental impacts. They explore population growth, interpret a line graph and calculate their own rate...
Curated OER
World Population
Students examine the world population data using MyWorld GIS software and compare and contrast the population characteristics of countries around the world. Students summarize their findings in a report.
Curated OER
Lesson 3: Understanding Population Growth
Young scholars explain population growth in Maryland and its relationship with age structure, household growth and consumption of land.
Curated OER
Estimation of Population Growth By Counting Offspring: Seed Multiplication
Students calculate the reproductive rate of a plant that creates multi seed fruits. They graph exponential growth and the complete a series of questions that help them infer that natural selection processes are at work in this population.
Curated OER
American Civilization - The Ice Age
First graders discuss the Ice Age land bridge over the Bering Straits and how it affected the population of the Americas. They construct a clay model of the land bridge and research common animals of the time.
Curated OER
Linking Population, Health, And Environment
Students evaluate the impact of our lifestyles on the environment and identify indicators of human impact on the environment. They explore the variation in quality of life in selected countries.
US Department of Commerce
The Place of My State
State the population of the state. Pupils research census data on the total population, the number of children their age, and the number of children of the same age and gender in their states. They write these numbers in standard,...
Curated OER
The Origin of Humans
Where did human beings come from? How did they settle into communities and civilizations? Your class will find the answers in this fascinating presentation, which takes the viewer through the stages of mankind, from the primitive...
Curated OER
Safety
Students examine crimes common among older adults. They compare the similarities and differences between crimes affecting both the young and old. They take and review a 'crime quiz'. They discuss resources in the community that provide...
Curated OER
Population Trends
Young scholars explore, examine and study the differences and similarities in the average ages of the populations of two countries in the EU. They interpret tables, draw and interpret diagrams and assess interpretations of a statistical...
Curated OER
From Data to Drinks - My Marketing Plan
Students research and discuss how Canada's aging population affects advertising. They record information from the 2001 census and create a marketing plan to sell a soft drink.
Curated OER
Who Is the Mature Adult
Middle schoolers recognize terms and concepts that are key in defining older adult population. They distunguish important demographics that encourage a better understanding of the mature adult population.
Curated OER
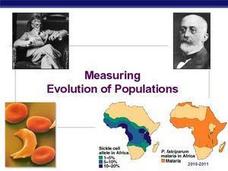
Measuring Evolution of Populations
The Hardy-Weinberg principle is the focus of this concise slideshow. Some vocabulary definitions are given on the first 2 slides, and the rest are given over to examples of the Hardy-Weinberg theorem. Calculations of the H-W...
Council for Economic Education
Wages and the Black Death
While the Black Death wiped out a third of Europe's population during the Middle Ages, its destruction paved the way for better wages for workers and even an early form of modern capitalism. The relationship between the cataclysmic...
Curated OER
Line Graphs
In this line graphs worksheet, 8th graders solve and complete 10 different problems that include various line graphs. First, they use each line graph shown to respond to the questions that follow regarding books and population. Then,...
Curated OER
Reading Bar Graphs
In this bar graphs worksheet, 8th graders solve and complete 10 different problems that include interpreting two different bar graphs. First, they determine the least profitable year for selling books. Then, students determine the age...
Curated OER
Immigration Graphs
Fourth graders study immigration. For this graphing lesson, 4th graders make a population graph of people who have immigrated to Indiana.
Curated OER
Graphs and Data
Pupils investigate poverty using graphs. In this algebra lesson, students collect data on the effects of poverty and use different rules to analyze the data. They graph and use the trapezoid rule to interpret the data.
Curated OER
From Restriction Maps to Cladograms
Biology aces analyze restriction maps to determine the relationships among different primate species and then complete a cladogram. Preface this lesson with an explanation of how restriction enzymes are used to create the DNA maps....
Curated OER
The Industrial Revolution: Matching
This online, interactive activity provides 21 matching questions about the industrial revolution. It covers people, events, inventions and more. Quiz-takers submit their answers and receive their score immediately.
Curated OER
Graphing in the Information Age
Middle schoolers create a variety of graphs based on population data. In this statistics lesson plan, students use data that can be gathered on-line to make a bar chart, line graph, and circle graph.
Curated OER
Age and Sex
Students create and analyze a population pyramid based on age and sex data from the 2001 Census. They explain and interpret the population pyramid other students have produced.


