Noyce Foundation
Granny’s Balloon Trip
Take flight with a fun activity focused on graphing data on a coordinate plane. As learners study the data for Granny's hot-air balloon trip, including the time of day and the distance of the balloon from the ground, they practice...
University of Colorado
Spacecraft Speed
Space shuttles traveled around Earth at a speed of 17,500 miles per hour, way faster than trains, planes, or automobiles travel! In the 13th installment of 22, groups graph different speeds to show how quickly spacecraft move through...
Fredonia State University of New York
Watch Your Step…You May Collide!
Can two lines intersect at more than one point? Using yarn, create two lines on the floor of the classroom to find out. Cooperative groups work through the process of solving systems of equations using task cards and three different...
Illustrative Mathematics
US Garbage, Version 1
An interesting example of a discrete function and how it is applies to the real world. This could easily make a good collaborative activity with an environmental science class. Practice reading a table and drawing a scatter plot make up...
Shodor Education Foundation
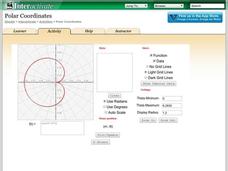
Polar Coordinates
Polar opposites might not work together—but polar coordinates do! The interactive provides learners the opportunity to graph trigonometric and algebraic functions using polar coordinates. The program takes either individual data points...
Curated OER
Algebra I: Graphing - Lesson Plan
Twelfth graders graph ordered pairs on a coordinate plane.
Curated OER
Graphing Inequalities
In this graphing inequalities worksheet, students create graphs of algebraic expressions containing inequalities. This two-page worksheet contains explanations and examples prior to the exercise. The first page is a contains...
Curated OER
Frequency Histograms, Bar Graphs and Tables #3
In this frequency histograms instructional activity, students examine bar graphs, histograms and tables. They identify the model of information that best matches the statistics. This three-page instructional activity cotnains...
Curated OER
Algebra II Review: Exponential Functions and Logarithms
In this Algebra II review: exponential functions and logarithms learning exercise, students solve 19 problems, including making graphs, simplifying and evaluating.
Curated OER
Equations of Graphs
For this equations of graphs worksheet, 9th graders solve and graph 10 different problems that include various types of graphs. First, they determine the equation for each graph shown at the top of the sheet. Then, students determine on...
Curated OER
Introductory Algebra Chapter 3 Review
In this math worksheet, students find the solutions to the problems while interpreting the line, bar, and circle graphs. The examples are given to help in the context of each objective.
Curated OER
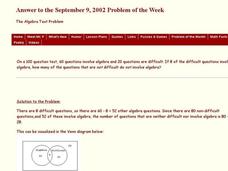
The Algebra Test Problem
In this algebra test worksheet, students construct and interpret a Venn Diagram. They determine the type of algebra problems designated in the Venn Diagram. This one-page worksheet contains 1 problem. The answer is...
Curated OER
Every Graph Tells A Story
Seventh graders explore linear equations. In this graphing instructional activity, 7th graders explore constant rates of change. Students discover the real-life application of graphs and demonstrate their ability to read...
Curated OER
Sunshine Math - 3
In this math review worksheet, students answer 5 word problems involving patterns and algebraic reasoning. Students then answer 1 story problem about the perimeter of a triangle. Next, students examine a graph and answer a 4 part fill...
Curated OER
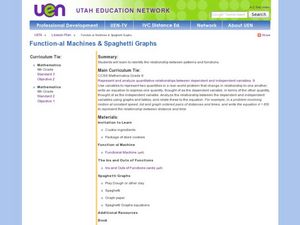
Function-al Machines and Spaghetti Graphs
Sixth graders identify the relationship between patterns and functions. For this algebra lesson, 6th graders use a "Functional Machine" to identify the rule. Students use a function table to plot the points using play dough dots.
Curated OER
Temperature Bar Graph
Students explore mean, median and mode. In this math lesson, students analyze temperature data and figure the mean, median, and mode of the data. Students graph the data in a bar graph.
Curated OER
Graph Functions with Integers
Fifth graders can do a quick review of graphing functions using integers with this worksheet. The worksheet has questions which require students to identify the pertinent information in a word problem, and create a graph to represent the...
Curated OER
Free Fall Graphing Exercise
Twelfth graders practice their graphing skills in an exercise about acceleration due to gravity. Lesson opens with a demonstration of acceleration due to gravity and a brief discussion. Students complete a worksheet and go over answers...
Curated OER
Long Distance Phone Plans
In this long distance phone plane worksheet, students compare various phone plans and determine which long distance plan has the greatest savings. Students support their answers visually through the use of tables and graphs. They write...
Curated OER
MP3 Purchase Plans
Use algebra to solve real world problems. Mathematicians practice use of graphs, tables, and linear functions to solve a problem regarding mp3 purchase plans. They work in groups to solve the problem and present their findings and...
Curated OER
Vertex Form of Parabolas
Using the method of completing the square, algebra learners rewrite quadratic equations from standard form to vertex form. They will also graph quadratics, stating the vertex and axis of symmetry. Solutions are provided.
Curated OER
Inequalities 7.3
Graph inequalities and discuss the difference in their slopes. Learners observe rate of change as they compare linear, quadratic, and cubic functions.
Curated OER
Count on Me
Fourth graders use inductive reasoning to find algebraic patterns in geometric figures. They use technology (i.e., calculators, computers) and manipulatives to discover number patterns involving geometric concepts. They solve concrete...
Curated OER
Solving Systems of Equations
Learners explore the concept of solving systems of equations with two equations and two unknowns. In this solving systems of equations lesson, they work through problems of solving systems by substitution, elimination, and graphing....


