Curated OER
Graphing Inequalities and Shading
Students graph and shade inequalities. In this algebra instructional activity, students graph inequalities using the slope-intercept form. They shade the side of the line that is the solution and identify the domain and range.
Curated OER
Computer Graphing Calculator Explorations
Students explore the graphing calculator feature on the Macintosh computer to explore some "parent" functions and their translations, combinations, and composites.
Curated OER
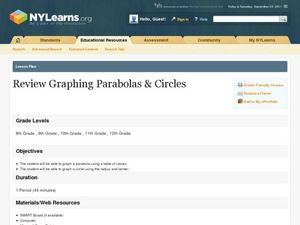
Graphing Parabolas and Circles
Pupils graph parabolas and circles. In this algebra lesson plan, students create a table of values and graph the coordinate pairs to create a graph. They graph a circle using the radius and center.
Curated OER
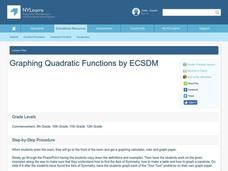
Graphing Quadratic Functions
Learners graph quadratic functions. In this algebra lesson, students identify the vertex and intercepts of a quadratic equations and graph the parabola. They find the axis of symmetry and make a table to find the values of the parabola.
Curated OER
Solving Quadratic Equations by Graphing
Pupils solve quadratic equation by graphing. In this algebra lesson, students use the TI calculator to get a visual of their graph. They create a table of values, plot their points and graph the parabola.
Curated OER
Coordinate Graphs, Translations and Reflections
Pupils perform translations and reflections. For this algebra lesson, students use the TI calculator to graph functions. They move the functions around on the coordinate plane using translation and reflection.
Curated OER
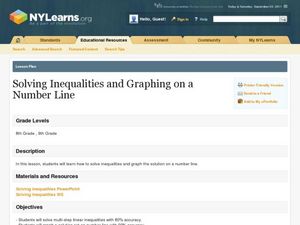
Solving Inequalities and Graphing
Young scholars solve and graph inequalities on a number line. In this algebra lesson, students solve using addition, subtraction, multiplication and division and graph their solutions using open or closed circles. They graph with 80%-90%...
Curated OER
Algebra/Geometry Institute Summer 2007: Graphing Activity
Seventh graders practice identifying coordinates by examining a city map. In this graphing lesson, 7th graders create coordinate directions on an index card and practice locating these locations on a grid. Students read and...
Curated OER
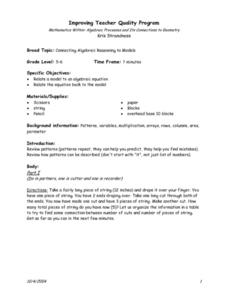
Connecting Algebraic Reasoning to Models
Students analyze relating a model to an algebraic equation and visa versa. Patterns are reviewed in detail and then in pairs new models are created and then translated into a word problem or equation. They illustrate their models on...
Curated OER
Proportionality in Tables, Graphs, and Equations
Learners create different methods to analyze their data. In this algebra lesson, students differentiate between proportion and non-proportional graph. They use the TI-Navigator to create the graphs and move them around to make their...
Curated OER
Chapter 11 - Objective 4.1 - Linear Equations
In this linear equation worksheet, students solve linear equations and then graph the solution on a coordinate plane. This one-page worksheet contains eight problems.
Curated OER
Interpreting Graphs
In this algebra worksheet, learners interpret graphs using given data and information. They are asked to relate real world scenario using algebraic equations. There are 31 questions with a variety of topics being covered.
Curated OER
Graphing Polynomials
Students graph polynomial equations using different methods. In this algebra lesson plan, students identify the different ways the x and y values relate in a graph. They solve for x by finding the zero's of the polynomials.
Curated OER
Functions and the Vertical Line Test
Students examine functions and function notation. They use computer activities to discover how to graph functions, and conduct a vertical line test. Students describe spatial relationships using coordinate geometry.
Curated OER
Lesson 3: Graphing Ordered Pairs on a Coordinate Plane
Students study how to graph ordered pairs on a coordinate plane. After a teacher demonstration, students work together to complete problems. They explain and share their answers. As an activity, they solve a mystery story about the...
Curated OER
Writing Equations of Parabolas in Vertex Form
Pupils use their knowledge of the vertex form of a quadratic equation to graph parabolas using a graphing calculator, given a specific move to make. this lesson may be used as a review or as extra practice, in groups or individually.
Curated OER
Inverse Functions
In this inverse functions worksheet, 9th graders solve and graph 10 different problems that include the inverse of various functions. First, they determine if the coordinates given is the inverse of a function given. Then, students use...
Curated OER
Adding and Subtracting Polynomials Using Algebra Tiles
Students add and subtract polynomials. In this algebra lesson, students use algebra tiles to perform operation of polynomials. They model their problems and understand how to combine like terms using tiles.
Curated OER
Solving Systems by Graphing
Students solve systems of equation through graphing. In this algebra lesson, students solve linear equations and analyze the result to figure out if there is one solution, no solution or infinitely many solutions. They graph their lines...
Curated OER
Data Analysis and Probability
Students make their own puzzle grid that illustrates the number of sit-ups students in a gym class did in one minute, then they make a histogram for this same data. Then they title their graph and label the scales and axes and graph the...
Curated OER
What's My Pattern?
Students recognize, describe and extend patterns in three activities. They organize data, find patterns and describe the rule for the pattern as well as use the graphing calculator to graph the data to make and test predictions. In the...
Curated OER
Veggie Chop and Data Analysis
First graders chop vegetables into fractions. In this fractions lesson plan, 1st graders cut vegetables, collect data about favorite vegetables and create a bar graph using the information. Students make inferences about the data...
Curated OER
Linear and Quadratic Functions
In this algebra worksheet, 11th graders solve quadratic functions using the quadratic formula. They take the square roots of both side of each equation then graph both the linear and quadratic functions. There are a total of 84 problems...
Curated OER
Regents High School Examination: Mathematics B
In this algebra, graphing, and geometry exam learning exercise, 12th graders complete 34 math problems. The skills for each question cover a variety of topics, and graphing on grid paper is required for some of the questions.


