Curated OER
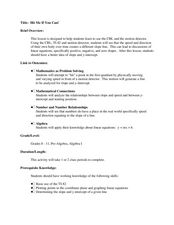
Hit Me If You Can!
Students graph linear equations using slopes and intercepts. In this algebra lesson plan, students identify the slope as being positive,negative or undefined. They differentiate between different quadrants on a coordinate plane.
Curated OER
Linear Functions-Learn Your Lines
Students solve and graph linear equations. In this algebra lesson, students collect and plot data on a coordinate plane. They use the CBL and TI calculator to graph systems of equation.
Curated OER
Slip Slide'n Away
Young scholars analyze the sliding of boxes along a warehouse floor. In this algebra lesson, students connect math and physics by calculating the friction created by the sliding of each box. They develop faster method to move the box,...
Curated OER
Building a Rover
Students investigate properties of lines and points by making a rover. In this algebra lesson, students plot points correctly on a coordinate plane. They identify coordinate pairs given the plots and lines.
Curated OER
Writing Linear Equations in Slope-Intercept Form
In this math worksheet, students are given three lines graphed on a coordinate grid. Students identify the slope, intercepts, and write an equation for each. Students find the intercepts of a linear equation, and graph them. They write...
Curated OER
Using a Multi- Sensory Approach
Students identify the slope of a line given two points on the line. In this algebra lesson, students solve linear equations by finding and comparing slopes of lines. They differentiate between the steepness of the slope and the line.
Curated OER
The Swinging Pendulum
Students observe a pendulum and graph their observation. In this algebra lesson, students use the TI calcualtor to graph the motion the pendulum makes. They analyze the graph and make predictions.
Curated OER
Iterating Linear Functions
Young scholars use a spreadsheet to investigate data. In this algebra lesson, students collect and graph data on a coordinate plane. They explain properties of a linear equation both algebraically and orally.
Curated OER
Modeling Population Growth
Students collect data on population growth. In this statistics lesson, students graph their data and make predictions. They find the linear regression and the best fit line.
Curated OER
Mathematical Relationships
Students practice graphing a linear equation and a parabolic equation. They work cooperatively to select numbers, including fractions, which they will put into ordered pairs. Students explain their process to the class, discussing what...
West Contra Costa Unified School District
Congruence Through Transformations
Transform your activity on transformations. Learners use given congruent triangles and tracing paper to determine the single transformation that carries one to the other. The concept is extended to combinations of transformations to...
Curated OER
A Point of Intersection
Students factor and solve systems of equation. For this algebra lesson, students identify the point of intersection using substitution, elimination and graphing. They write an equation given a system and a graph.
Curated OER
Entrance Ticket
Students collect data on different events and word problems. In this algebra lesson, students use a table to organize their data. They graph their coordinate pairs on a coordinate plane and make predictions.
Curated OER
Constructing and Solving Linear Equations
Students solve linear equations In this algebra lesson, students create linear equations using integer coefficients greater than one. They graph their solution on a coordinate plane.
Curated OER
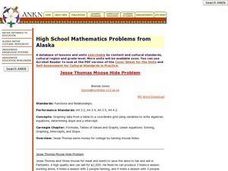
High School Mathematics Problems from Alaska: Jesse Thomas Moose Hide Problem
Students solve problems about a student earning money for college by tanning moose hides.
Curated OER
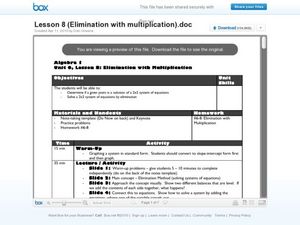
Elimination with Multiplication
Learners solve equations using linear combination. In this algebra instructional activity, students solve a system by checking if a given pair of coordinates are solution to the system. They solve the system using elimination, and...
Curated OER
Relations and Functions
Students differentiate between a relation and a function. In this algebra lesson, students identify a pair of coordinates as being a relation or a function. They analyze graphs for function as they solve word problems.
Curated OER
Writing Equations from a Table
Students use coordinates in a table to write equations. In this algebra lesson, students discuss rate of change as it relates to slope and x and y values. They plot the points from a table to graph their lines and write an equation for...
Curated OER
Writing Equations from a Table
Learners graph and evaluate equations. In this algebra lesson, students are given pairs of coordinates and asked to write an equation representing the values. They are also given values to plug in to their equations and evaluate.
Curated OER
Race The Rapper: Slopes
Students calculate the slope of the equation In this algebra lesson plan, students graph coordinate pairs of linear equations and identify the relationship between x and y values and slope. They differentiate between functions and...
Curated OER
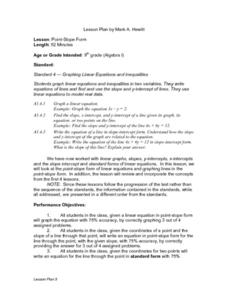
Point-Slope Form
Ninth graders explore the point-slope form of linear equations and graph lines in the point-slope form. After completing the point-slope equation, they identify the slope of a line through a particular point. Students explain the...
Curated OER
How are we Related?
Students differentiate functions based on their domain and range. In this algebra lesson plan, students define function, domain, range and relation. They analyze graphs and coordinate pairs for input and output values making up a function.
Curated OER
Where am I Located
Learners calculate and find a certain location. In this geometry lesson plan, students examine a coordinate plane for pair of coordinates. They calculate the distance between point using the distance formula and estimation.
Curated OER
Linear Equations and Cell Phone Plans
Young scholars calculate the amount of minutes they get charged for each month. For this algebra lesson, students relate linear equations to talking on the phone and the cost to do so. They create graph to plot the cost and usage of the...
