Curated OER
Linear and Non-Linear Equations
Learners study linear and non-linear equations. After a teacher demonstration, they use calculators to solve and graph equations. They distinguish the difference between linear and non-linear equations.
Curated OER
Solving Systems by the Elimination Method
Pupils solve equations by elimination and use the TI to graph the lines and find the point of intersection.
Curated OER
System of Two Quadratic Inequalities
Young scholars graph a quadratic inequality and describe its solution set. They solve a system of quadratic equalities graphically and symbolically and as related to a real-world context.
Curated OER
Not Everything is More Expensive
Students explore percent increases and decreases. They calculate the percent increase and decrease. Students use math to solve problems and communicate. They apply the given formula for percent increase/decrease.
Curated OER
Let's Take a Chance!
Learners investigate probability and the chance of an even happening. In this algebra lesson, students incorporate their knowledge of probability to solve problems and relate it to the real world. They learn to make decisions based on data.
Curated OER
Introduction to Slope
Students distinguish between positive and negative slope. They calculate the slope of various lines. Students identify and generate perpendicular and parallel lines base on their slope.
Curated OER
Systems of linear inequalities in slope-intercept form
Students graph a linear inequality and describe its solution set. They solve a system of linear equalities graphically and symbolically. Students set up and solve a system of linear inequalities using linear programming techniques. ...
Curated OER
Balsa Wood Airplane Flight and Speed Correlation
Ninth graders calculate the average speed of their balsa wood airplane. In this physics activity, 9th graders build their own airplane and make necessary modifications to to make it fly straight. They interpret distance and time graph...
Curated OER
Absolute Maximum and Minimum
Students calculate the maximum and minimum of each function. In this algebra instructional activity, students collect and graph data to analyze it. They differentiate between the absolute max and min and the maxima and minima of each...
Curated OER
Ball Toss Activity
Pupils collect data from tossing a ball into the air. Using a data collection device, they graph the data, set a window, and analyze the height of the toss, how long the ball was in the air, etc. They then find an equation that models...
Curated OER
Mathematical Magazines
Students look through magazines and calculate the percentages of the types of ads in the magazines. In this percentages lesson plan, students create a graph to show their results.
Curated OER
Putting Your Best Foot Forward
Third graders measure their feet and their parents' feet, record data on computer-generated graphs, and calculate and record mean, median, and mode.
Curated OER
Solar Speed
Students perform unit conversion. In this algebra lesson, students calculate the distance and speed of a solar car. They graph their result as speed versus distance and analyze it.
Curated OER
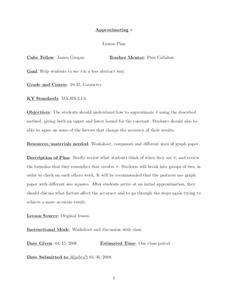
Approximating Pi
Young scholars approximate Pi using the lower and upper bound for the constant. In this algebra lesson, students work in groups of two to graph a circle and approximate Pi using the circumference. They repeat their estimation until they...
Curated OER
Tracking Your Favorite Web Sites
Ninth graders track the hit count on their favorite web sites. In this Algebra I lesson, 9th graders record the number of hits on their favorite web site for twenty days. Students explore the data to determine if the relation...
Curated OER
Percents and Discounts
Young scholars convert between decimals and percents. In this algebra lesson, students define percent as it relates to sales and tax. They calculate the percents of number using multiplication.
Curated OER
Factoring Trinomials
Young scholars factor trinomials using specific steps. In this algebra instructional activity, students factor polynomials following the steps on a smart instructional activity. They review important vocabulary to help with solving the...
Curated OER
Don’t Sit Under the Apple Tree…You Might Become Famous
Students explore Newton's laws using CEENBoTs. In this physics lesson plan, students collect data and create tables and graphs. They calculate speed, acceleration and forces using mathematical formulas.
Curated OER
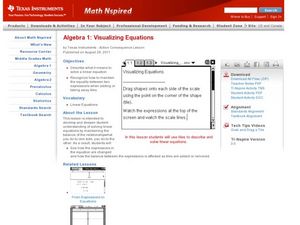
Visualiziing Equations
Students use visuals and words to solve equations. In this algebra lesson, students observe the necessary steps needed to add, subtract,multiply and divide to solve an equation. They graph their solution using the TI calculator.
Curated OER
What is a Solution to a System?
Students define the solution to a system of equation. In this algebra lesson, students graph two line on the TI calculator and identify the point of intersection if there is any. They find one, zero or infinitely many solution and...
Curated OER
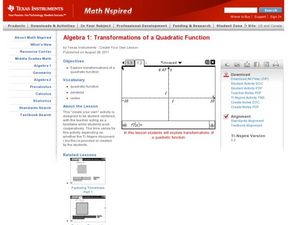
Transformations of a Quadratic Function
Young scholars graph quadratic functions. In this algebra activity, students perform transformation on the TI calculator as they create a visual. They identify the vertex and intercepts of the parabola.
Curated OER
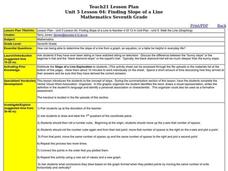
Finding Slope of a Line
Students calculate the slope of a line. In this algebra activity, students graph a line using the slope and y-intercepts. They define the steepness of the line using the slope.
Curated OER
How Much Data is That?
Students differentiate between exponential and logarithmic functions. In this algebra instructional activity, students use logarithmic properties to solve equations. They identify growth and decay of graphs.
Curated OER
Systems of Linear Inequalities in Standard Form -- Lecture
Learners participate in a lecture about linear inequalities. Individually, they graph different inequalities and describe its solution. They participate in a demonstration in which they solve a system of inequalities and complete a...
