Curated OER
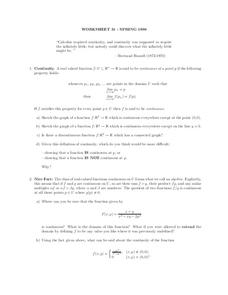
Worksheet 31 - Spring 1996
In this math learning exercise, students read the definition of continuity found in Calculus. Then they graph the functions while defining the points of continuity.
Curated OER
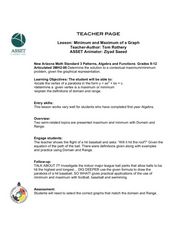
Find Minimum and Maximum
Learners engage in a lesson about finding the values of different graphs written in the vertex form. They rewrite each quadratic equation in vertex form while graphing the equation with the visual display of a parabola that matches the...
Curated OER
Limits
For this limit worksheet, students evaluate functions and determine the limits of the function. This one-page worksheet contains 10 problems.
Curated OER
Math Honors 2: Trigonometry Review Questions
In this Algebra II/Trigonometry worksheet, students solve problems involving angle of depression or elevation, evaluate trigonometric expressions, solve trigonometric equations, and graph trigonometric functions. The one page worksheet...
Curated OER
Compare and Contrast
Students graph equations using the y-intercept. In this algebra lesson, students investigate functions based their slope and y-intercept. They learn to analyze graphs by comparing the y-intercepts of the graphs.
Curated OER
Minimum and Maximum of a Graph
Students find the solutions of polynomials through graphing. In this algebra lesson, students identify the maximum and minimum of each polynomial function. They ind the vertex, domain and range of a parabola.
Curated OER
Finding a Line of Best Fit
Pupils engage in the practice of creating a scatter plot with the data obtained from measuring different resting heart rates. The data is used to create the table that is translated into a graph. The lesson gives instructions for the use...
Curated OER
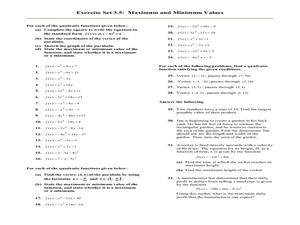
Maximum and Minimum Values
In this Algebra II worksheet, 11th graders complete the square to write a quadratic equation in Standard form. Students identify the vertex, sketch the graph and state the maximum or minimum value of the functions. The one...
Curated OER
Using Linear Models
In this Algebra II worksheet, 11th graders examine models whose behavior can be described by a linear function. The four page worksheet contains explanation of topic, three guided problems, and eight practice problems. ...
Curated OER
Candy Experiment
Students investigate why a slope is negative. In this algebra lesson, students differentiate between negative and positive slopes by graphing. They collect data, write an equation and graph using the slope.
Curated OER
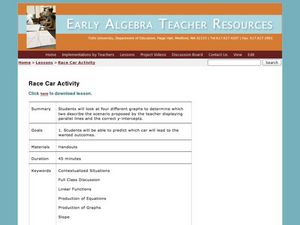
Race Car Activity
Students investigate linear functions. In this linear functions lesson, students are given a situation where two race cars start at the same point. Students have four graphs that they match to the race car scenario. ...
Curated OER
Ball Toss Activity
Pupils collect data from tossing a ball into the air. Using a data collection device, they graph the data, set a window, and analyze the height of the toss, how long the ball was in the air, etc. They then find an equation that models...
Curated OER
Who Won the Cross-Country Meet?
Students write verbal expressions into algebraic expressions and solve the expressions. They determine who wins a race by determining the algebraic expression.
Curated OER
Race Track (Culminating Activity)
Students graph and solve linear equations. In this algebra lesson, students use the slope and y-intercept to graph lines. They relate lines to the real world using different applications.
Curated OER
Worksheet 11
In this math worksheet, students define a function f(x) by the following rule: for any x ∈ R,set. They also define the domain and range for the functions.
Curated OER
Linear Equations
Students solve linear equations by modeling. In this algebra lesson plan, students solve one and two step inequalities and equations. They use manipulative to create a visual of the steps.
Curated OER
Parabolas
In this Algebra I/Algebra II worksheet, students identify the vertex and the axis of symmetry of a parabola, given the equation. The two page worksheet contains a combination of ten multiple choice and free response...
Curated OER
Domain and Range 2
How do you identify the domain and range of the function? As learners find out it's as easy as creating a graph. They'll identify the domain and range of a relation from its graph, write symbolic expressions describing the relationship...
Curated OER
Exploring Transformations
Young scholars investigate functions and their transformations. They move absolute value functions around on the coordinate plane, and then define the transformation and plot the new graph. The table feature of the TI-calculator is used...
Curated OER
Domain and Range
Your class will grasp the concept of domain-and range on a graph by using their TI navigator to graph their lines. They observe the effect of a function and non-functions based on the domain and range.
Curated OER
Parabolas
In this Algebra I/Algebra II worksheet, learners determine the vertex and the axis of symmetry of a parabola. The two page worksheet contains a combination of eleven multiple choice and free response questions. Answers are...
Curated OER
Natural Logarithm
Young mathematicians solve problems of logs and natural logs. They graph functions of natural logs on the TI and relate integrals to natural logarithms.
Curated OER
A Penny Saved is a Penny Earned
Students explore the concept of exponential growth. For this exponential growth lesson, students manipulate power models with base 2. Students discuss what would happen if you doubled a penny over the course of 20 days. ...
Illinois State Board of Education
Is It Linear?
Math apprentices are introduced to the components of a linear relationship. In groups, they write story problems that incorporate this relationship and relates to the real world. They give their problem to the class for them to solve.
