Inside Mathematics
Expressions
Strive to think outside of the quadrilateral parallelogram. Worksheet includes two problems applying prior knowledge of area and perimeter to parallelograms and trapezoids. The focus is on finding and utilizing the proper formula and...
Mathematics Vision Project
Module 9: Modeling Data
How many different ways can you model data? Scholars learn several in the final module in a series of nine. Learners model data with dot plots, box plots, histograms, and scatter plots. They also analyze the data based on the data...
Noyce Foundation
Ducklings
The class gets their mean and median all in a row with an assessment task that uses a population of ducklings to work with data displays and measures of central tendency. Pupils create a frequency chart and calculate the mean and median....
Curated OER
Algebra I: A Draining Swimming Pool
Learners analyze and develop symbolic representations to describe the amount of water left in a pool being pumped out after a given amount of time, with various pumping rates and initial quantities of water in the pool.
Curated OER
Linear Patterns in Data
Eighth graders extend their learning of graphing linear equations and are introduced to connecting patterns in tables and graphs to represent algebraic representations. They then determine patterns and extrapolate information from these...
Curated OER
Functions and the Vertical Line Test
Students explore the concept of functions. In this function lesson, students determine if the graph is a function by using the vertical line test. Students use an applet to explore the vertical line test on a variety of graphs.
Curated OER
Polynomial Multiplication
Pupils review information about how to multiply polynomials and then work in pairs to complete a worksheet. They use graphing calculations to help them solve their math problems.
Curated OER
Can you Find the Expression
Learners collect data from measurements and weights for this experiment. In this algebra lesson, students analyze graphs they create form their data to find the expression representing the data. They label which graph provided the best...
Curated OER
Equations and Systems of Equations
Students practice using algebra to be applied to real world situational problems. The key concepts of translation of language to algebraic expressions is covered. They also look in depth at relationships between different quantities.
Curated OER
Cartesian Coordinate System
Students explore the Cartesian coordinate plane and plot points on the graph. They interpret coordinates for a point from the graph and give the ratio of rise over run for slope.
Curated OER
Using Inequalities to Problem Solve
Students explore inequalities. In this Algebra I lesson, students solve and graph linear inequalities involving addition, subtraction, multiplication, or division. Students use inequalities to solve and graph real-world problems.
Curated OER
Cell Phone Plans
Students relate the use of a cell phone to math. In this algebra lesson plan, students collect data on the usage of their phones and plot it. They analyze the graph and make predictions based on the rate per minute.
Curated OER
Water in the Texas Coastal Basins
Students, after researching a Texas coastal basin, map and graph the information they collect and then translate it into a short report to be presented to their classmates. They brainstorm unique ways to maintain Texas estuaries as well...
Curated OER
Race The Rapper: Slopes
Learners calculate the slope of the equation In this algebra lesson, students graph coordinate pairs of linear equations and identify the relationship between x and y values and slope. They differentiate between functions and...
Curated OER
Limits
Learners practice the concept of limits graphically, numerically and algebraically. They participate in an exploration lab, BINGO game and complete a puzzle.
Curated OER
Word Problems
Students solve word problems using mathematical symbols. For this algebra lesson, students collect data and analyze it. They analyze the data using a table or graph after plotting the data.
Curated OER
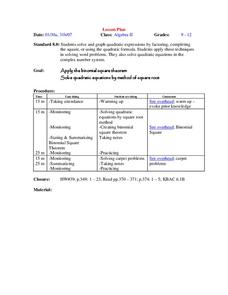
Quadratic Equations and Binomial Square Theorem
Students factor quadratic equations. In this algebra lesson, students apply the binomial square theorem to solve quadratics. They complete the square and use the complex number system to solve for the roots.
Curated OER
Linear Systems
Students solve and graph linear equations. In this algebra lesson, students solve systems of equations using elimination and substitution. They graph their answer and identify the point of intersection.
Curated OER
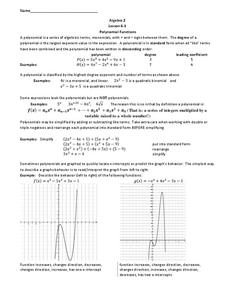
Polynomial Functions
In this Algebra II worksheet, 11th graders classify polynomials by degree, write in standard form, and describe the behavior of the graph. The two page worksheet provides explanation and examples along with thirteen practice...
Curated OER
More Complicated Functions: Introduction to Linear Functions
Young scholars explore the concept of linear functions. In this linear functions lesson plan, students translate linear functions from tables to graphs to equations. Young scholars use an applet to write a function rule for a linear...
Curated OER
How Much Will I Spend On Gas?
Students construct a linear graph. In this graphing lesson, students determine a monthly budget for gasoline. Students construct a t-chart and coordinate graph to display data. Resources are provided.
Curated OER
Discovering Growth Patterns
Students explain the differences between linear (arithmetic) and exponential (geometric) growth. They use worksheets imbedded in this lesson plan to help them make predicitions and graph data points.
Curated OER
Choosing a Summer Job
What did you do over your summer vacation. Young wage earners must compare summer job options, and determine when each job earn the same amount and what that amount be. This be done by creating, graphing, and solving systems of...
Curated OER
I Can Do This! Systems of Equations
Students solve systems of 2-by-2 linear equations using tables,
graphs and substitution. In small groups, classmates work together to discover strategies for solving equations. They use a calculator to graphically represent their answers.


