Curated OER
That Was Then, This Is Now
Learners examine the price of food over time. They analyze charts, perform math operations and compare and contrast data about the price of food. They complete worksheets while interperting the charts.
Curated OER
Spreadsheet Budget Project
Eighth graders record all the food they eat for one week, compute the costs for all of this food, and display the different categories on a spreadsheet and then convert to a chart.
Curated OER
Bird Beak Adaptation Lab
Middle schoolers investigate bird beaks to determine which physical adaptations are necessary based on the types of food the birds eat. They participate in a lab by visiting multiple stations to determine which beaks are most efficient,...
Curated OER
Cooking a Few of my Favorite Things
Second graders publish a class cookbook of their own recipes. They explore the nutritional value of foods, calculate the measurements, and prepare a healthy recipe for the class.
Curated OER
Yum - Yum!! - The Digestion Lesson
Students explore the various components of the digestive system and learn about both the physical and chemical processes that work together to break down food into absorbable molecules.
Curated OER
Burning Snacks in Chem Lab
High schoolers determine the energy content of various snack foods. They measure the temperature changes in various snack foods as the foods are burned in order to determine the foods' energy content. Students create graphs and data...
Curated OER
KEEP ON TRUCKING
Students comprehend and apply concepts of data analysis and distributions by observing modes of transportation for food and fiber products. They are given an activity sheet "On the Lookout for Agriculture." Students discuss the discuss...
Curated OER
Fertilizers, Pesticides and Health
Students apply real data to create and calculate algebraic equations. Students create a visual to represent the concentration for one part per million and apply unit analysis to verify measurement computations. Students define the use...
Curated OER
Family Activity: Bar Graphs and Line Graphs
In this math worksheet, students work at home with a family member on a graphing activity. Students count the number of cans, glass jars, boxes and bags in the pantry. Students make a bar and a line graph to represent the data.
Curated OER
Eating and Being Healthy
Students investigate healthy lifestyles by examining the food pyramid and performing physical activities. In this personal health instructional activity, students discuss their own diets and how it compares to the food...
Curated OER
Solar Energy - Dehydration
Sixth graders explore process of drying food using solar energy. They cook and/or dry food such as pumpkins, watermelon, corn, and deer meat, explain how solar energy changes foods, and compare and contrast solar energy with other forms...
Curated OER
Bacteria in Your Life
In this bacteria learning exercise, students conduct an experiment by looking through their cupboard and refrigerator at home and locating the expiration date on six foods. Then they record what they found in the table shown. Students...
Curated OER
Colored Drops
Young scholars examine the properties of a liquid that contains water and food coloring and a liquid that contains water, food coloring and a liquid detergent. They interpret their data, describe properties, and make reasonable...
Curated OER
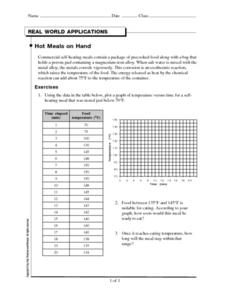
Hot Meals on Hand
In this exothermic reactions worksheet, students read about how commercial hot meals are heated through the use of exothermic reactions. They graph data of temperature and time elapsed for hot meals and answer two questions about the graph.
Curated OER
CSI Clamshell Investigation
Pupils explore and explain how moon snails eat and where the holes in clamshells come from and then draw conclusion from the data collected. They incorporate math and graphing skills to determine if there is a relationship to a clam's...
Curated OER
Paramecium
For this paramecium worksheet, students sharpen their science skills as they color the parts of a paramecium according to the instructions and then respond to 15 analysis questions.
Curated OER
Finding Caterpillars
Young scholars examine how animals protect themselves from predators and camouflage themselves. They participate in a simulation in which they locate red and green yarn "caterpillars," organize their data, and generate a bar graph using...
Curated OER
Surface Area of Cubes and Rectangular Prisms
Eighth graders calculate surface area of 3-D shapes. In this geometry lesson, 8th graders analyze cubes and prisms by finding their area and surface area. They compare the data of these two shapes.
Curated OER
A Helthy Diet
Students examine their eating habits and experience analyzing data and drawing conclusions. They construct models of the molecular backbone of saturated and unsaturated fats. In addition, they examine the labels of their food, record...
Curated OER
Impact of Exotic Species on Lake Ecology
Students examine the effect of foreign species on various habitats. In groups, they identify the population dynamics of the zebra mussel. They calculate averages and graph data from Seneca Lake in New York. They develop hypothesis...
Curated OER
How Does Your Plant Grow?
Students measure and record their height in centimeters on a graph. By integrating math and science, students collect data and apply graphing skills to the experiences they are having growing plants. Finally, students identify how to...
Curated OER
Pie Charts
For this math worksheet, middle schoolers complete the work in order to chart the data into the pie graph. The picture is used for statistical analysis.
Curated OER
What Do Snails Eat?
Students conduct a food choice experiment with snails, recording the results on a chart to determine what snails eat. In this what do snails eat lesson, students color a picture of snail anatomy, perform the experiment with 3 food...
Curated OER
Energy Balance: The Ins and Outs
Students review data from a 24-hour dietary recall to gain an understanding of the information regarding energy intake and macronutrients.
Other popular searches
- Cost/benefit Analysis Food
- Food Label Analysis
- Food Analysis
- Food Drive Data
- Cost Analysis Food Service
- Dog Food Analysis


