Curated OER
Circle Graphs
Sixth graders interpret, create, and display data in a circle graph. In this circle graph lesson plan, 6th graders use a compass, protractors, pizza boxes, and more to create a circle graph and analyze the data they put into it.
Curated OER
Graphing Data Brings Understanding
Students collect, graph and analyze data. In this statistics lesson, students use circle, pie, bar and lines to represent data. They analyze the data and make predictions bases on the scatter plots created.
Curated OER
Using Computers to Produce Spreadsheets and Bar Graphs
Students review graphing terminology and how to plot data points, how to input data into a spreadsheet, and how to make a chart using a computer.
Curated OER
Get the Picture with Graphs
Fifth graders examine line, bar and circle graphs in the newspaper and on the Internet. They complete sketches of graphs with an emphasis on selecting the best model to depict the data collected.
Curated OER
Temperature Bar Graph
Learners explore mean, median and mode. In this math lesson, students analyze temperature data and figure the mean, median, and mode of the data. Learners graph the data in a bar graph.
Curated OER
Favorite Candy Bar Graph
Students decide on six different types of candy bars to include in a data collection activity. Working in small groups, they survey a target group in a set amount of time. They access a Internet based graphing tool to create a bar graph...
Curated OER
Making a Bar Graph
In this bar graph worksheet, students analyze a data table and bar graph depicting information about stickers collected. Students answer 5 questions about the data displayed.
Curated OER
Graphing Linear Equations with Calculator
Students graph lines using the calculator. In this algebra lesson, students graph lines of equations in the form y=mx+b. They input equations into the TI Calculator and graph using the slope and intercept. They analyze the graph for...
Curated OER
Graph Your Motion
Learners graph their linear equations. In this algebra lesson, students examine their lines and relate it to the slope or rate of change. They relate the steepness of the line to the slope being positive, negative or zero.
Intel
What Does This Graph Tell You?
Students choose natural phenomena to research. They design and conduct experiments or simulations. Students predict, gather, and analyze data. They graph the results using a spreadsheet software.
Curated OER
Mean, Mode and Bar Graphs
In this mean, mode and bar graphs worksheet, 5th graders analyze the data given, then answer three questions about a bar graph and the data shown.
Curated OER
Graphing Linear Functions
Seventh graders identify the use of a function.They are asked to describe the input and output of a function. Students also identify different aspects of the coordinate system and represent functions in a visual graph.
Curated OER
Problem-Solving Application: Use Circle Graphs
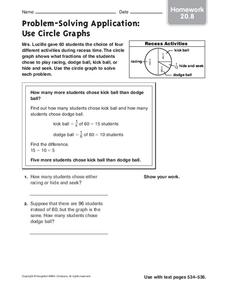
In this problem solving worksheet, students analyze the information in a circle graph about recess activities. Students use this graph to solve 2 application problems.
Curated OER
Graph Related Linear Inequalities
High schoolers explore the concept of linear inequalities. In this linear inequality lesson, students graph linear inequalities using Microsoft Excel.
Curated OER
Seized Before Flights: Graph
In this bar graph worksheet, students analyze a graph that show the number of prohibited items intercepted at U.S. airport screening checkpoints. Students answer 3 problem solving questions about the data on the graph.
Curated OER
Bar Graph- Calories In Fast Food Items
In this bar graph worksheet, students analyze a bar graph that shows calories in 10 fast food menu items. Students answer 7 questions about the graph.
Curated OER
Reading Bar Graphs: My Favorite Subject
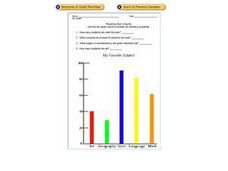
In this bar graphs worksheet, students analyze a bar graph about favorite school subjects. Students use the information on the graph to answer 7 questions.
Curated OER
Analyzing Non-Fiction Text Features- Graphs
Students examine the text features of non-fiction. For this literacy lesson, students practice reading graphs and discover the authors intent for using them in primary and secondary sources.
Curated OER
Circle Graph
In this math worksheet, students analyze a circle graph. The circle graph can be used for a variety of math activities and divided into different fractions.
Curated OER
Analyzing Nonfiction Text Features - Graphs
Students examine the text features of non-fiction. In this literacy instructional activity, students practice reading graphs and discover the authors intent for using them in primary and secondary sources.
Curated OER
Discovering Magnets and Graphs
Sixth graders investigate averages and statistics by discovering magnet strengths. In this magnet experiment lesson, 6th graders utilize different magnets and attempt to attract different materials to them. Students record the...
Curated OER
Analyze and Interpret Statistical Information
In this probability and statistics activity, 9th graders analyze and interpret histograms as they identify trends in the data. The two page activity contains four problems. Answers are provided.
Curated OER
More graphing situations by making a table
Students make a table and graph plotting points. In this algebra lesson, students graph linear equations on a coordinate plane. They calculate the rate of change and analyze the graph for extrapolation.
Curated OER
Long Distance Phone Plans
For this long distance phone plane worksheet, students compare various phone plans and determine which long distance plan has the greatest savings. Students support their answers visually through the use of tables and graphs. They write...


