Curated OER
Graphs and Pictograms
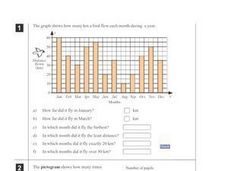
In this graphs and pictograms worksheet, learners analyze both a graph and a pictogram and then answer 11 questions about them. Students can click on the Check button to determine whether their answers are correct or not.
Curated OER
Statistical Analysis for Graphing Calculators
High schoolers use data from the Chesapeake Bay to analyze temperature, phosphate, nitrates, salinity, and oxygen levels.
Curated OER
Human Activity and the Environment
Students review and analyze graphs and tables as a group. They develop their graph and data analysis skills by converting data tables from Human Activity and the Environment into graphs.
Curated OER
Challenge: Graphing Functions
Here is a functions worksheet in which learners solve functions containing variables, graph the coordinates, and answer two questions about it. They complete 14 functions.
Curated OER
The Blizzard of 1993
Students read and interpret the information from a barograph from a major winter storm. This task assesses students' abilities to interpret and analyze graphs, construct data tables and graphs, generalize, infer, apply knowledge of...
Curated OER
Graphing Quadratic Equations
Review the form of a quadratic function, and the parabola it creates. Continue on with the whole group to work through a mini-lab, practicing how to graph quadratic equations with one variable. The goal of this activity is for the group...
Shodor Education Foundation
Graphing and the Coordinate Plane
Ready to introduce your class to the coordinate plane? This website includes a detailed lesson plan that includes two interactive games to help learners practice graphing ordered pairs. The scripted discussion is a little cheesy and a...
Curated OER
Graphs: All About Our Class
Students respond to survey questions, discuss results, brainstorm ways to represent survey information, and create table of class results. They find mean, range, and percentages, and create graph to display results.
Curated OER
Creating and Analyzing Graphs of Tropospheric Ozone
Students create and analyze graphs using archived atmospheric data to compare the ozone levels of selected regions around the world.
Curated OER
Unit III: Worksheet 3 - Uniform Acceleration
This three-page instructional activity moves physics masters to show what they know about motion. They analyze graphs of time versus displacement, solve instantaneous and average velocities, solve word problems, and graph results. This...
NOAA
Graphing Temperatures
Battle of the hemispheres? In the fourth installment of a five-part series, young oceanographers use the NOAA website to collect temperature data from drifters (buoys), one in the Northern Hemisphere and one in the Southern Hemisphere....
Teach Engineering
A Shot Under Pressure
You've got to pump it up! Using the equations for projectile motion and Bernoulli's Principle, class members calculate the water pressure in a water gun. The pupils collect data on the number of pumps and distance traveled in order to...
Chicago Botanic Garden
GEEBITT (Global Equilibrium Energy Balance Interactive TinkerToy)
Students use the GEEBITT excel model to explore how global average temperatures are affected by changes in our atmosphere in part two of this series of seven lessons. Working in groups, they discuss, analyze graphs, and enter data to...
Balanced Assessment
Ford and Ferrari
Which is faster, a Ford or a Ferrari? The short assessment has pupils analyze graphs to determine the rates of change between the two. Individuals interpret the rates of change within the context of speeds of the cars and develop a map...
Chicago Botanic Garden
Historical Climate Cycles
What better way to make predictions about future weather and climate patterns than with actual climate data from the past? Young climatologists analyze data from 400,000 to 10,000 years ago to determine if climate has changed over time....
Curated OER
Scatter-Brained
Seventh graders graph ordered pairs on a coordinate plane. They create a scatterplot. Additionally, they determine the line of best fit and investigate the slope of the line. Multiple resources are provided. An excellent resource!
Cornell University
Non-Newtonian Fluids—How Slow Can You Go?
Children enjoy playing with silly putty, but it provides more than just fun. Young scientists make their own silly putty using different recipes. After a bit of fun, they test and graph the viscosity of each.
Curated OER
Show Me!
Students analyze and interpret graphs. In this graphing lesson, students view a video and construct their own graphs (line, circle, bar) from given sets of data.
Curated OER
Tracking the Wild Ones
Students apply mathematic skills to discover the extent of the concern for endangered species. Students analyze graphs and look for trends in graphed results of endangered species on a global level.
Curated OER
Graphing Perfect Competition
In this Graphing Perfect Competition worksheet, learners analyze seven graphs, then must add to them or create their own based on directions.
Curated OER
Graphing and Analyzing Biome Data
Students explore biome data. In this world geography and weather data analysis lesson, students record data about weather conditions in North Carolina, Las Vegas, and Brazil. Students convert Fahrenheit degrees to Celsius degrees and use...
Curated OER
Analyze This Function
In this derivatives worksheet, students solve 11 short answer and graphing problems. Students find inflection points, increasing and decreasing intervals, maximums and minimums, and graph an exponential derivative. Students use the...
Curated OER
Graphing Sea Ice Extent in the Arctic and Antarctic
Students graph sea ice data and predict long term trends in the data. In this climate change lesson, students use sea ice data from the Arctic and Antarctic to construct line graphs. They use their graphs to predict the effects of global...
Inside Mathematics
Quadratic (2009)
Functions require an input in order to get an output, which explains why the answer always has at least two parts. After only three multi-part questions, the teacher can analyze pupils' strengths and weaknesses when it comes to quadratic...


