Curated OER
Twelve Days of Christmas--Prediction, Estimation, Addition, Table and Chart
Scholars explore graphing. They will listen to and sing "The Twelve Days of Christmas" and estimate how many gifts were mentioned in the song. Then complete a data chart representing each gift given in the song. They also construct...
Curated OER
Data Analysis Challenge
In this data analysis worksheet, young scholars work with a partner to collect information for a survey. The information is then compiled into a graph. Young scholars must indicate their survey question, the target audience, predict the...
Curated OER
Math Can Be Electrifying
Students explore how math can be used to calculate and analyze how electricity causes air pollution. Students design a campaign to educate family members on ways they can save electricity. They create a graph that compares two electric...
Curated OER
Voter Turnout
Explore politics by analyzing the voting process. Pupils discuss the purpose of casting votes in an election, then examine graphs based on the data from a previously held election's turnout. The lesson concludes as they answer study...
Curated OER
A Saturating Exponential
Your learners analyze the familiar model of a cold beverage warming when it is taken out of the refrigerator. The general form of the equation and its graph are presented. Learners learn about the specific pieces of the function by...
Curated OER
Unit II Worksheet 4 - Constant Velocity/Motion Maps
This is a smart approach to displacement concepts. Physics learners analyze a motion map and then draw qualitative graphs for time versus displacement and time versus velocity. Get your class thinking critically through the use of a very...
Utah Education Network (UEN)
Mathematics: Growing Patterns
Learners graph growing patterns using ordered pairs on a coordinate grid. They read The Fly on the Ceiling, a Math Myth.
Curated OER
Who am I? Find A Polynomial From Its Roots
High schoolers generate the equation of a polynomial given its roots and the end behavior of the function. They need to apply theorems concerning the multiplicity of roots, conjugates of irrational or imaginary roots to find a...
Curated OER
Teaching Reading Comprehension through Social Studies Readings
Examine how immigrants have changed the environment of the United States. Individually, middle schoolers will take a pre- and post-test to assess their reading comprehension. In groups, they compare and contrast the religions of...
Teach Engineering
Energy Intelligence Agency
Protect the world from energy depletion—join the Energy Intelligence Agency. Using a set of cards, pupils distinguish between correct and incorrect information regarding energy use in the United States. They analyze graphs and diagrams...
ProCon
Israeli - Palestinian Conflict
Many people think the best solution to the Israeli-Palestinian conflict is a two-state solution. After reviewing the available resources, scholars determine whether they agree with that approach. They analyze graphs and charts about...
Flipped Math
Calculus AB/BC - Extreme Value Theorem, Global Versus Local Extrema, and Critical Points
It is critical to find all the extreme points. Pupils analyze graphs in the presentation to determine whether there are points that are either maximums and minimums. Using derivatives, learners find out how to find critical points from...
Smithsonian Institution
Vaccines! How Can We Use Science to Help Our Community Make Decisions about Vaccines?
Uncover the fascinating world of vaccines in a multifaceted activity. Investigators explore community perception and the science of vaccines with eight tasks. Scientists continue their studies by giving and reviewing surveys, analyzing...
NASA
Comparing Temperature and Solar Radiation for Common Latitudes
There's snow much to learn! Excited individuals use real-world data to discover how latitude affects the odds of a snow day. Scientists compare latitude, solar radiation, and temperature using NASA data for several locations....
Curated OER
Introduction to Representing and Analyzing Data
Represent data graphically. Allow your class to explore different methods of representing data. They create foldables, sing songs, and play a dice game to reinforce the measures of central tendency.
Curated OER
ABC...Have Fun With Me!
Throw out those old ABC worksheets and try some new and engaging hands-on activities to teaching the alphabet!
Curated OER
Evidence of Change Near the Arctic Circle
Students analyze graphs and make conclusions about climate change. In this climates lesson students produce graphs and identify relationships between parameters.
Curated OER
Proportionality in Tables, Graphs, and Equations
Students create different methods to analyze their data. In this algebra lesson, students differentiate between proportion and non-proportional graph. They use the TI-Navigator to create the graphs and move them around to make their...
Curated OER
Coin Tossing and Graphing
Fifth graders use technology as assistance to collecting random data. Through the random data they will be able to explain the significance of getting a head or tail depending on what was previously landed on. They will then analyze the...
Curated OER
Analyzing Health
Third graders analyze their health. In this analysis lesson plan, 3rd graders rate their health on a 1-10 scale. They then tally the scores from the class and create a data chart. Then they answer true and false questions based on...
Balanced Assessment
Alcohol Level
How long does it take alcohol to leave your system? Individuals explore this question by examining a polynomial function. They draw conclusions by analyzing the key features of the given polynomial function.
Curated OER
Tables, Charts and Graphs
Students examine a science journal to develop an understanding of graphs in science. In this data analysis lesson, students read an article from the Natural Inquirer and discuss the meaning of the included graph. Students create a...
Curated OER
Graphing Radical Functions-A Graphic Introduction
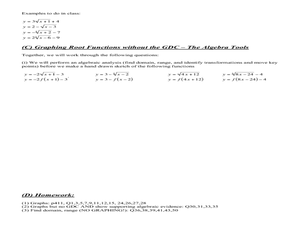
In this Algebra II worksheet, 11th graders graph root functions and analyze the domain, range, intercepts, maximum and minimum values, and end behavior. students use that information to transform the graphs of root functions. The three...
Curated OER
Graph Creator
Students rewrite equations using algebraic symbols. In this algebra activity, students graph linear equations using the slope and y intercept. They make predictions about their graphs and analyze the results.


