Hi, what do you want to do?
E-learning for Kids
E Learning for Kids: Math: Russian Toy Store: Data and Graphs
Students will play a learning game to interpret data on graphs.
National Center for Ecological Analysis and Synthesis, University of California Santa Barbara
Kids Do Ecology: Data and Science
Learn about conducting your own investigation with these tips on following the scientific method. Find out how to state hypothesis, make observations, collect and analyze data, and display data to share results and conclusions of your...
E-learning for Kids
E Learning for Kids: Math: Tea Store: Data and Graphs
Play games by exploring how to interpret bar graphs and organize data in a table.
ClassFlow
Class Flow: Data Analysis Using Graphing
[Free Registration/Login Required] This flipchart allows students to analyze data using appropriate graphs, including pictographs, histograms, bar graphs, line graphs, circle graphs, and line plots introduced earlier, and using...
E-learning for Kids
E Learning for Kids: Math: Pizza (Italian) Restaurant: Data and Chance
In this interactive site, students practice with bar and picture graphs by helping a pizza place collect and analyze their data.
Texas Education Agency
Texas Gateway: Selecting and Using Representations for Collected Data
[Accessible by TX Educators. Free Registration/Login Required] Given a variety of data (including line plots, line graphs, stem and leaf plots, circle graphs, bar graphs, box and whisker plots, histograms, and Venn diagrams), the student...
Texas Education Agency
Texas Gateway: Scientific Investigation and Reasoning Data Organization
Using interactive exercises, students will review how to construct tables and graphs in order to organize data.
Mangahigh
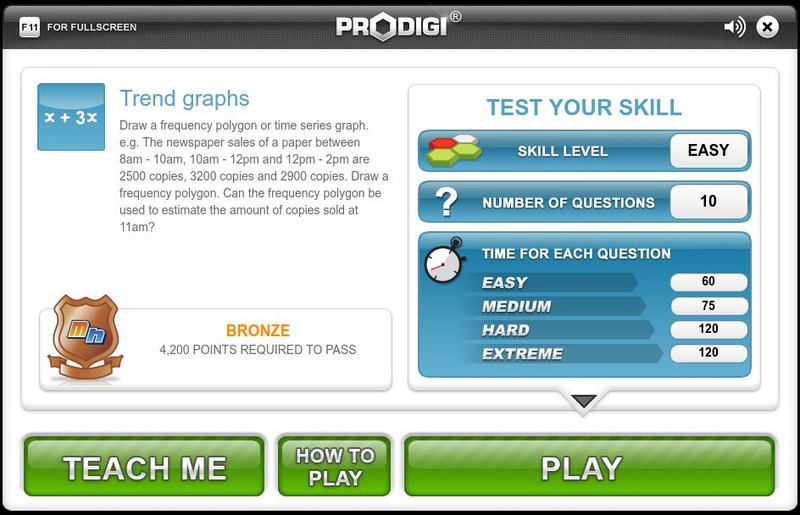
Mangahigh: Data: Trend Graphs
Students explore the concept of frequency trend graphs by working through an online tutorial and then attempting a ten question quiz that increases in difficulty as questions are answered correctly.
Science Education Resource Center at Carleton College
Serc: Lab 3: Discovering Local Data
An investigation that is part of a series of lab lessons that expose students to Earth Systems through research, data, and visulazations. This lab specifically has students using a database to gather and graph data to understand the role...
University of Waterloo (Canada)
Wired Math: Organizing Data Grade 7 [Pdf]
A collection of worksheets that focus on data analysis and organizing data. Includes detailed examples, colorful visuals, and a link to a related game. Acrobat Reader required.
Texas Instruments
Texas Instruments: Data Analysis
Students learn to design data investigations, describe data, and draw conclusions. They learn to choose the best type of graph, graph and interpret the data, and look for patterns and trends. They also use the calculator to investigate...
Yale University
Yale University: Categorical Data Examples
Site provides some different examples of categorical data and discusses the use of two-way tables.
Government of Alberta
Learn Alberta: Math Interactives: Exploring Election Data
Using actual Alberta provincial election results, students have the opportunity to interpret election data using a variety of graph types. Pictographs, line graphs, bar graphs, circle graphs, and data tables are covered in this...
Khan Academy
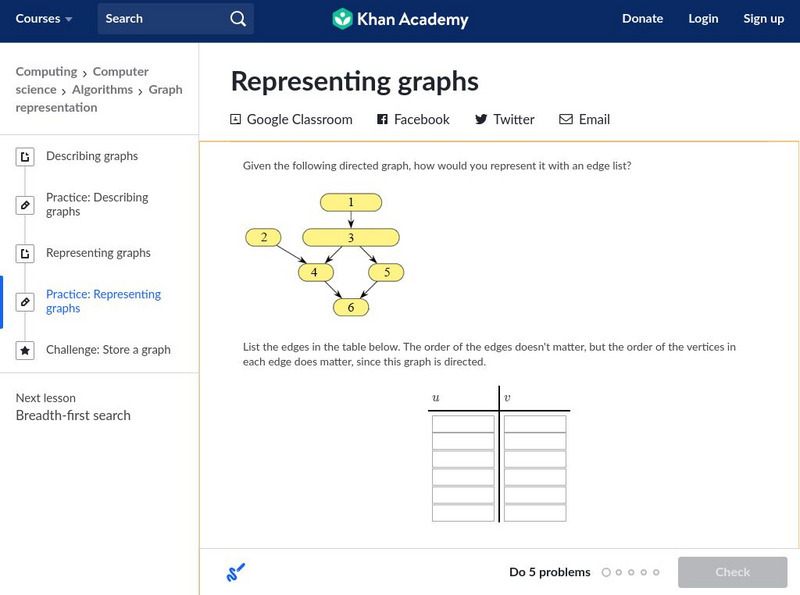
Khan Academy: Representing Graphs
Some practice problems with data and graph representation in computer science.
American Association of Physics Teachers
Com Padre Digital Library: Open Source Physics: Data Tool Program
Use this online data analysis tool to build graphs and display results from scientific investigations. Data can be entered directly with the keyboard or imported from, and exported to spreadsheets.
Texas Instruments
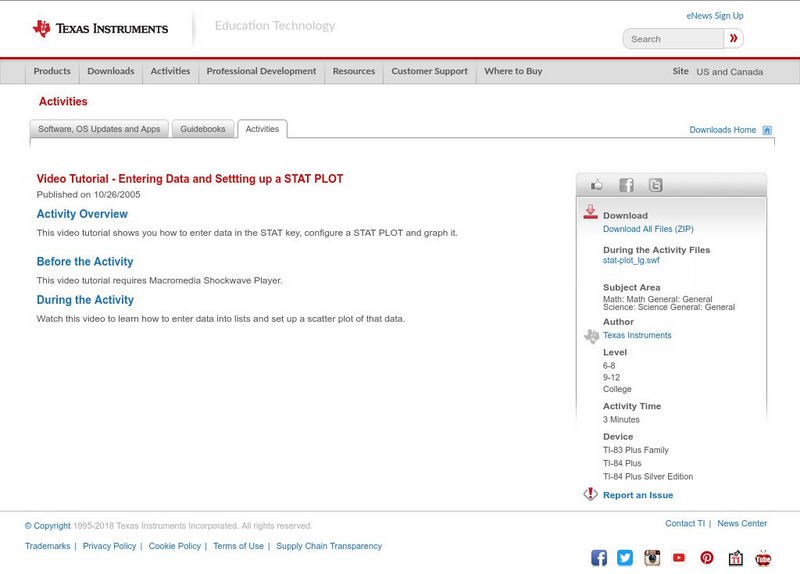
Texas Instruments: Video Tutorial Entering Data and Settting Up a Stat Plot
This video tutorial shows you how to enter data in the STAT key, configure a STAT PLOT and graph it.
Government of Alberta
Learn Alberta: Math Interactives: Exploring Data Display and Graphs
This multimedia Learn Alberta math resource focuses on graphing data. In the video portion, students will see how math is involved in the display of merchandise in stores. The accompanying interactive component provides an exploration...
National Council of Teachers of Mathematics
The Math Forum: Growth Creature Lab Data Collecting
Lesson plan completely explains how students will collect data on the growth of an "alligator" and determine the relationship of the growth data to the Fundamental Theorem of Similarity and to topics in geometry in general. All of the...
NOAA
Noaa: Estuaries: Noaa: Science Data: Graphing
Create graphs of marine ecosystems using real-time data.
Texas Education Agency
Texas Gateway: Informational Text: Synthesize Information in Charts and Graphs
In this lesson, you will learn how to understand the data found in charts and graphs, and at the end of the lesson, you will practice what you have learned.
Khan Academy
Khan Academy: Read Line Plots (Data With Fractions)
Practice reading and interpreting data that is graphed on line plots. The data graphed includes fractions. Students receive immediate feedback and have the opportunity to try questions repeatedly, watch a video or receive hints....
E-learning for Kids
E Learning for Kids: Math: Dinosaurs: Data and Chance
Students can play learning games to explore how to label, read, and create graphs using a dinosaur theme.
Read Works
Read Works:north America:comparing Data From Different Countries Around the World
[Free Registration/Login Required] A chart with land and population data from Canada, the United States of America, the United Kingdom, and Japan. A question sheet is available to help students build skills in reading comprehension.
E-learning for Kids
E Learning for Kids: Math: Music / Dance Performance: Data and Chance Experiments
On this interactive site students use the setting of a dance performance to predict all possible outcomes and make vertical and horizontal bar graphs.









![Wired Math: Organizing Data Grade 7 [Pdf] Activity Wired Math: Organizing Data Grade 7 [Pdf] Activity](https://static.lp.lexp.cloud/images/attachment_defaults/resource/large/FPO-knovation.png)


