Hi, what do you want to do?
Other
Drs.cavanaugh: Science proj.handbook, Display Checklist
A checklist of the nine or ten items which should be on your display, plus an illustration of where they should go on a tri-fold poster.
Better Lesson
Better Lesson: Misleading Leading Graphs
Through the use of real life data, the students will be looking at a variety of graphs to decide if they are displaying misguided information.
Khan Academy
Khan Academy: Picture Graphs (Pictographs) Review
Picture graphs are a fun way to display data. This article reviews how to create and read picture graphs (also called pictographs).
Better Lesson
Better Lesson: Would You Rather Be a Kid or a Grown Up?
Would you rather be a kid or a grown up? This question interests students and engages them in an interesting graphing exercise focused on how many total data points there are in a graph.
University of Texas at Austin
Mathematics Teks Toolkit: And We Go Around
Collect and display data using a bar and circle graph to explore fractions and percents.
Other
Delta State University: Lesson Plan 3: Pie Graphs
The students will gather, organize, and display data in an appropriate pie (circle) graph using M&M's! [PDF]
Science and Mathematics Initiative for Learning Enhancement (SMILE)
Smile: Apples a Peel to Me
This lesson plan helps children understand how to graph data by using both real objects, apples, and pictures of apples. Great activity for a variety of themes.
Richland Community College
Richland Community College: Stats Graphs Defined
Richland Community College provides a glossary of many terms that are needed in order to understand statistics graphs and charts. Each of the types of charts is quickly explained in terms of what it is most effective in displaying.
American Museum of Natural History
American Museum of Natural History: O Logy: Stuff to Do: Start a Rock Collection
Step-by-step details for building a rock collection, beginning with collecting specimens, moving on to observing and sorting rocks, and finishing with displaying the collection. Includes a data table for keeping track of all your...
Better Lesson
Better Lesson: Unit Assessment
Survey says? That is the question today, as students work on three different tasks to assess the how they are doing with the skills from the current unit.
McGraw Hill
Glencoe Mathematics: Online Study Tools: Histograms
This site gives a short interactive quiz which allows students to self-assess their understanding of the concept of histograms.
University of Illinois
University of Illinois: Spreading It Thick
Resource contains the definition for variance. It also shows students how to calculate the variance. There is a link to a bar graph that displays variance for the data example.
Khan Academy
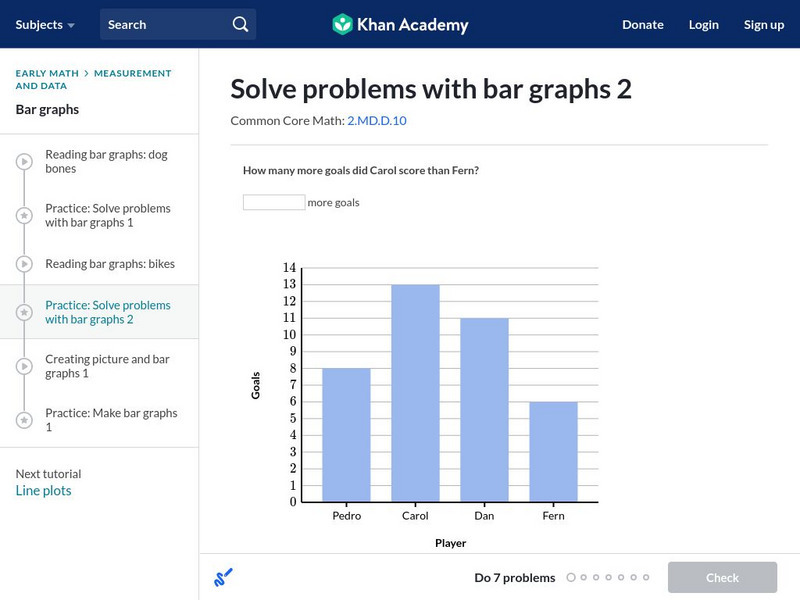
Khan Academy: Solve Problems With Bar Graphs 2
Use bar graphs to solve addition and subtraction word problems. Students receive immediate feedback and have the opportunity to try questions repeatedly, watch a tutorial video, or receive hints.


