E-learning for Kids
E Learning for Kids: Math: Rice Field: Data and Length
On this interactive website students practice various math skills using a real life scenario of a rice field. Those skills include understanding information displayed in column graphs, collecting data to answer a question, and measuring...
Better Lesson
Better Lesson: Using Table Data: Time to the 1/2 Hour
My students have learned how to read and write time. Now I want them to see how important time is for us to organize our lives. I want them to use data charts for schedules and be able to analyze the information.
Better Lesson
Better Lesson: Balancing and Comparing Data
The connection between subjects is an important one to establish for students. Communicating across subjects is part of the Common Core expectations.
Other
Drs.cavanaugh: Science proj.handbook, Display Checklist
A checklist of the nine or ten items which should be on your display, plus an illustration of where they should go on a tri-fold poster.
Better Lesson
Better Lesson: Survey Skills: Assessment
Today we become Gallup Poll central as students take a set of collected data and create a visual representation using the skills that have been taught over the past few lessons.
Better Lesson
Better Lesson: Our Own Surveys
Operation Independence! Students will now take what they have learned from previous data lessons and put it into action. The students will work in pairs of two to decide on a survey question and then collects classmates' responses to...
Better Lesson
Better Lesson: Misleading Leading Graphs
Through the use of real life data, the students will be looking at a variety of graphs to decide if they are displaying misguided information.
Better Lesson
Better Lesson: Would You Rather Be a Kid or a Grown Up?
Would you rather be a kid or a grown up? This question interests students and engages them in an interesting graphing exercise focused on how many total data points there are in a graph.
University of Utah
University of Utah: Aspire: The Aspire Breadboard
This is a tutorial for creating a breadboard with an LED display as an educational outreach effort for the Telescope Array cosmic ray research project near Delta, Utah. When completed, the breadboard could be programmed to use actual...
Richland Community College
Richland Community College: Stats Graphs Defined
Richland Community College provides a glossary of many terms that are needed in order to understand statistics graphs and charts. Each of the types of charts is quickly explained in terms of what it is most effective in displaying.
US Geological Survey
Usgs: Water Quality of San Francisco Bay
This resource from the United State Geological Survey provides data about San Francisco Bay's water quality. Data is displayed in time series plots, vertical profiles, longitudinal sections, space and time contours, and x-y scatter plots.
Rice University
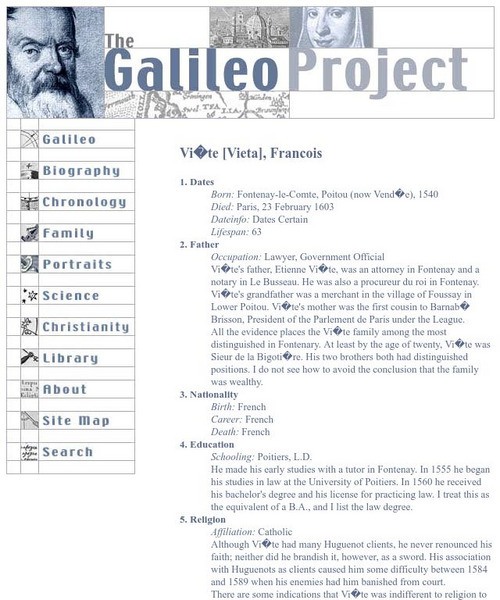
Galileo Project: Francois Viete
This site from The Galileo Project of Rice University provides a brief overview of Francois Viete, displayed as ten biographical topics. The fields of data collected include topics such as birth/death dates, father, nationality,...
American Museum of Natural History
American Museum of Natural History: O Logy: Stuff to Do: Start a Rock Collection
Step-by-step details for building a rock collection, beginning with collecting specimens, moving on to observing and sorting rocks, and finishing with displaying the collection. Includes a data table for keeping track of all your...
TeachEngineering
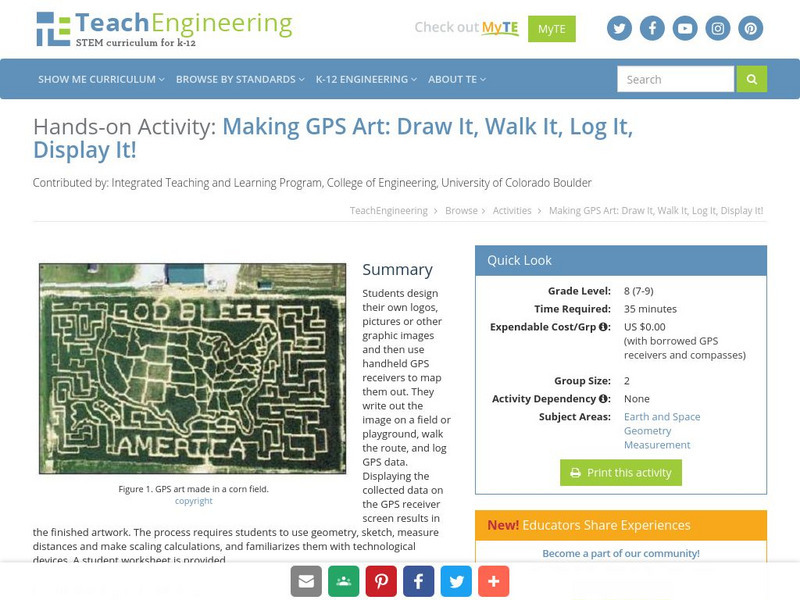
Teach Engineering: Gps Art
Students design their own logo or picture and use a handheld GPS receiver to map it out. They write out a word or graphic on a field or playground, walk the path, and log GPS data. The results display their "art" on their GPS receiver...
Better Lesson
Better Lesson: Unit Assessment
Survey says? That is the question today, as students work on three different tasks to assess the how they are doing with the skills from the current unit.
Khan Academy
Khan Academy: Dot Plots and Frequency Tables Review
Dot plots and frequency tables are tools for displaying data in a more organized fashion. In this article, we review how to make dot plots and frequency tables.


