Curated OER
Survey Says...
Young learners create and implement a school-wide survey about student body favorites! Learners record and analyze the data on a bar graph, picture graph, and line graph, and then display the data. Then, wrap it all up with a celebration...
Curated OER
Finding Equations
Students make equations from everyday data. They create a graph from the equations. Students predict and analyze the results. Students complete the second scenario on their own and turn in their handout.
National Museum of Nuclear Science & History
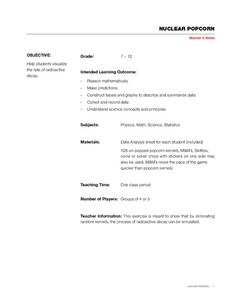
Nuclear Popcorn
Make your lesson on radioactive decay pop with this lab exercise. Using popcorn kernels spread over a tabletop, participants pick up all of those that point toward the back of the room, that is, those that represent decayed atoms. As the...
Curated OER
Graph Lesson
First graders collect data on different eye colors of each student in their classroom. They input the data that they gathered in an Excel spreadsheet and then create a graph in Excel.
Curated OER
Global Warming - The Heat is On: Global Climate Change Revisited
After listening to your lecture on climate change, young scientists access NOAA's database listing Mauna Loa's carbon dioxide data. They graph the monthly means and then compare their graphs to NOAA's. This is a concise plan that could...
Curated OER
Measures of Center
For this statistics worksheet, students find mean, median, and mode for 3 problems. They find the mean of summarized data in 2 problems.
Illustrative Mathematics
Bike Race
A graph not only tells us who won the bike race, but also what happened during the race. Use this resource to help learners understand graphs. The commentary suggests waiting until the end of the year to introduce this topic, but why...
Curated OER
Graphing
Students collect data to create different types of graphs-line, pie, and bar graphs. They use StarOffice 6.0 to create graphs.
Curated OER
Gummy Bear Math
First graders predict, collect data, and create a graph based on gummy bear colors they are given. For this graphing lesson plan, 1st graders first predict how many colors of gummy bears there are. They then count the colors, graph them,...
Curated OER
Mean, Median, and Mode
Fourth graders compare two sets of data by using a double bar graph. In this data analysis lesson, 4th graders study a double bar graph and complete questions based upon the data. Students construct a table to show the data from the...
Curated OER
Graphs
Students explore graphs and define the different ways they are used to display data. In this algebra instructional activity, students collect data and plot their data using the correct graph. They draw conclusions from their graphs based...
Curated OER
Graphing Pasta
Young scholars sort and graph various types of pasta. Using pasta construction paper patterns or real pasta, they sort the pasta by color, size, and type, and record the data on a graph.
Curated OER
Comparing Linear and Exponential Data
Students graph linear and exponential equations. In this algebra lesson, students differentiate between linear and exponential equations. They relate it to the real world.
Curated OER
Beginning Graphs in MS Excel
Students practice creating graphs in Microsoft Excel. In this technology lesson, students conduct a random survey and collect data. Students use the Microsoft Excel program to create a bar graph of the data.
Curated OER
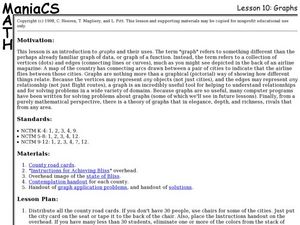
Lesson 10: Graphs
Students explore graph theory. In this geometry lesson, graphs are used to solve problems in a variety of domains. In this lesson the term graph refers to a collection of vertices and edges used to depict...
Curated OER
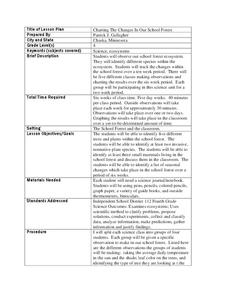
Charting the Changes in Our School Forest
Fourth graders investigate the ecosystem and how forests are disappearing. For this environmental protection lesson, 4th graders analyze the changes in their school for 2 weeks. Students practice identifying trees, birds, and...
Curated OER
Cost Calculations Lesson Plan
Students analyze data using graphs and equations. In this algebra instructional activity, students calculate the cost of lumber, convert price per foot to price per piece, solve equations using addition and subtraction and give exact...
Curated OER
Data Days
Sixth graders practice collecting, organizing and displaying data. They create circle, bar, line and picto graphs. They analyze data in small and large sample groups.
Curated OER
Graphing Fun
First graders analyze objects and make a graphing picture to analyze the data. In this graphing lesson, 1st graders complete an object graph assessment, a picture graph assessment, and a bar graph assessment to analyze their given objects.
Curated OER
Chart/Graph
Students create a class survey, place the data in a spreadsheet and graph the information.
Curated OER
Point Graphs
Students experiment with point graphs. In this math lesson, students are divided into groups and perform an experiment to see how high a ball bounces, recording their results on a point graph. Students then answer provided questions.
Curated OER
Price of Apples- Linear Data
Students collect data and create a graph. In this algebra lesson, students describe functions graphically, algebraically and verbally. They identify functions as being independent and dependent using variables.
Curated OER
A Data Processing Lesson for Statistics -- Reading a Table or Chart
Students identify the structure and key parts of tables and charts. They determine which data is meanjngful and make comparisons with the data. They describe the scope of the AIDS plague throughout the world.
Curated OER
Skittle Graphing (Lesson Plan)
Students discuss the uses of graphs. They use color candies to count and sort before designing graphs. They label the graph papers with appropriate titles and candy colors. They complete the graph bars, and discuss the results with a...


