Curated OER
Locating Vent Fields Using CTD Data
Students describe the way hydrothermal vents work. Students work on locating vent regions through remote collection of data about water temperature and density. Comparing density and temperatures graphs, students search for indicators...
Curated OER
Weather "Whys"
Students complete activities to explore fall weather. In this weather lesson, students use the given links to examine weather forecasts. Students complete a weather graph activity and watch Internet field trips. Students complete fall...
Curated OER
Diffusion & Osmosis with Data Analysis
Young scholars explore principles governing diffusion and osmosis. Students perform a dialysis tubing experiment. They obtain core samples of potato in varying concentrations of sugar-water to measure water potential of the potato...
Curated OER
Logarithmic Transformations of Data
Students investigate and study logarithmic equations. In this precalculus lesson, students analyze the data behind the function. They define each graph as positive, negative or no correlation. They find the line of best fit.
Curated OER
Population Dilemma
Ninth graders explore population growth. In this Algebra I activity, 9th graders conduct an experiment simulating population growth. Students create a model and relate the results to a real-world situation. ...
Curated OER
I'm Out of Here
Students create a travel budget. In this budget lesson, students research vacation destinations. Working independently, students research destinations on the Internet and construct a budget for the vacation. Resources provided.
Curated OER
Sunspot Graphing
Students, using 15 years of sunspot data, plot data on a classroom graph. They discuss why the pattern from their individual sheets did not and could not match the class graph.
Curated OER
Graphs Abound
Students create a survey for their classmates to collect data on their favorite foods, eye color, pets or other categorical data. They compile the data from the survey in a table and then make a bar graph of each category using a web tool.
Curated OER
Graphing Pockets
Second graders explore graphing. They count the number of pockets on their clothes and use Microsoft Excel to enter their data. Students create a class graph displaying their findings.
Curated OER
Correlating Atmospheric Data Lesson Plan
Students make and test hypotheses about atmospheric data collected aboard the NOAA ship Ronald H. Brown research cruise.
Curated OER
Tourism in London
Students discuss the tourist attractions that are in London. They examine how data can be manipulated by completing a worksheet. They plan a trip to a London attraction after conducting Internet research.
Curated OER
Endangered Species
Ninth graders graph data in order to compare the number of extinct species and a rise in human population. They analyze the data collected. Students are encouraged to infer the relationship.
Curated OER
Growing a Seed
Seeing how seeds grow into plants is such an enjoyable for students! They plant lima bean seeds and take pictures to record the growth of their plants. Students write in a journal to describe their daily observations of their plants, and...
Curated OER
Using Imported Data in Excel
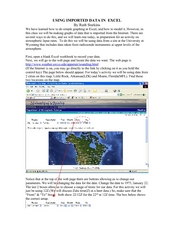
Learners import atmospheric data from the internet. In this earth science instructional activity, students graph the data they collected. They complete the worksheet after the activity.
Curated OER
Rouge River Data
Students participate in using Excel sofware in order to create graphs. They create the graphs using data that they gathered during the Rouge River Field Trip they attended. The produce bar graphs from the excel spreadsheets.
Curated OER
Pancakes, Anyone?
First graders explore data collecting and graphing. In this data collecting and graping lesson, 1st graders watch a video about monster who sells pancakes. Students make a graph to record the most popular pancake. Students also play...
Curated OER
Cartesian Coordinates
Students investigate rational numbers through data analysis and statistics. For this algebra lesson, students represent, rename, compare and order rational numbers. They collect and represent data correctly on a graph.
Curated OER
Determining Rates from Graphs
Learners explore how to calculate rates. In this rate calculation lesson, students watch a CyberSquad video and then calculate positive, negative, and zero rates from graphs.
Curated OER
Burger King Investigation
Students study data on the nutritional value of Burger King meals in order to discover its nutritional value and also to compare the meals, using mathematical computation, to the recommended daily diet. In this data handling lesson...
Curated OER
Shedding Light on the Weather with Relative Humidity
Learners study weather using a graphing calculator in this lesson plan. They collect data for temperature and relative humidity for every hour over a day from the newspaper, then place the data in their handheld calculator and examine it...
Curated OER
Is Global Warming Happening?
Students investigate the probability of global warming and the effects of global warming on the environment. They conduct Internet research and collect data, transfer the data onto an Excel spreadsheet, and create a presentation that...
Curated OER
Name That Tune: Matching Musical Tones Through Waveform Analysis
Pupils detect the waveform of musical notes to determine the code for the "safe" in this forensics simulation lesson. They use a microphone and tuning forks along with Vernier EasyData on their graphing calculator to analyze five musical...
Curated OER
Parachute Drop
Learners will have fun creating a parachute to collect data with. They will construct the parachute in small groups, measure the materials, and create an observation sheet. Then they drop the parachute and make predictions about how long...
Curated OER
Analyzing Tree Rings to Determine Climate Change
Students examine how to locate and access data sets. In this climate change activity students import data into Excel and graph it.


