Texas Education Agency
Texas Gateway: Analyze Graphical Sources: Practice 2 (English I Reading)
This lesson focuses on practice exercises to understand and interpret the data in a graphic representations including pie charts, bar graphs, and line graphs.
Texas Education Agency
Texas Gateway: Analyze Graphical Sources: Practice 2 (English I Reading)
You will look at each of these types of graphs: bar graph, line graph, pie charts, as you work your way through the lesson.
McGraw Hill
Glencoe: Self Check Quizzes 1 Analyzing Graphs
Use Glencoe's randomly generated self-checking quiz to test your knowledge of how to analyze graphs. Each question has a "Hint" link to help. Choose the correct answer for each problem. At the bottom of the page click the "Check It"...
TeachEngineering
Teach Engineering: A Lego Introduction to Graphing
Students use a LEGO ball shooter to demonstrate and analyze the motion of a projectile through use of a line graph. This activity involves using a method of data organization and trend observation with respect to dynamic experimentation...
University of Illinois
University of Illinois: Earthquakes of the World
Resource contains a lesson plan that utilizes data from earthquakes. Students are instructed to analyze and interpret line graphs that display the earthquake data.
University of Waterloo (Canada)
Univ. Of Waterloo: Wired Math: Linear Graphing: Graphing and Analyzing [Pdf]
The mathematics resource assesses students on linear relations. The activity has problems with graphing and analyzing linear relations. Some of the topics included are variation, scatter plots and linear relationships. The worksheet has...
McGraw Hill
Glencoe: Using Graphs to Understand Data Quiz
This is a quiz with five quick questions to check your knowledge of how to use graphs to understand data. It is self-checking.
Texas Instruments
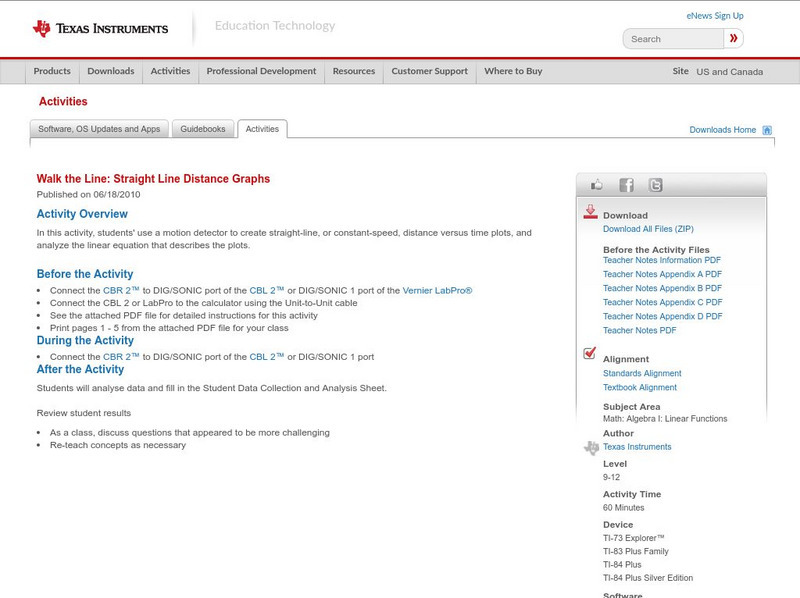
Texas Instruments: Walk the Line: Straight Line Distance Graphs
In this activity, students' use a motion detector to create straight-line, or constant-speed, distance versus time plots, and analyze the linear equation that describes the plots.
ClassFlow
Class Flow: Charts Handling Data
[Free Registration/Login Required] Reading graphs fit together with this engaging, colorful flipchart analyzing pie charts, bar graph, percents, and fractions.
Math Graphs
Houghton Mifflin: Math Graphs: Equation of a Tangent Line 7 [Pdf]
The example analyzes the equation of the tangent line to the graph at the given point. The practice problem is available in PDF format.
Texas Instruments
Texas Instruments: A Sweet Drink Adventure 7
Students determine how the temperature of water affects the dissolving time of a sugar cube. They create, interpret and analyze graphs of data, find an equation of the line of best fit, and relate slope to rate of change.
Concord Consortium
Concord Consortium: Stem Resources: Seeing Motion
With this interactive tool and the use of a motion sensor, students will track their own motion and, as they collect data in several experiments, they will plot it on a distance-time graph. After completing the three experiments, they...
Alabama Learning Exchange
Alex: Relationship Between Height and Length
In this activity, eighth grade students will collect data. They will use this data to analyze the relationship between the height of an individual and the length of his/her foot. Students will use a line of fit to make predictions for...
McGraw Hill
Glencoe: Interpreting Data Quiz
This is a quiz with five quick questions to check your understanding of how to interpret data. It is self checking.


![Univ. Of Waterloo: Wired Math: Linear Graphing: Graphing and Analyzing [Pdf] Unknown Type Univ. Of Waterloo: Wired Math: Linear Graphing: Graphing and Analyzing [Pdf] Unknown Type](https://d15y2dacu3jp90.cloudfront.net/images/attachment_defaults/resource/large/FPO-knovation.png)


