Hi, what do you want to do?
Stanford University
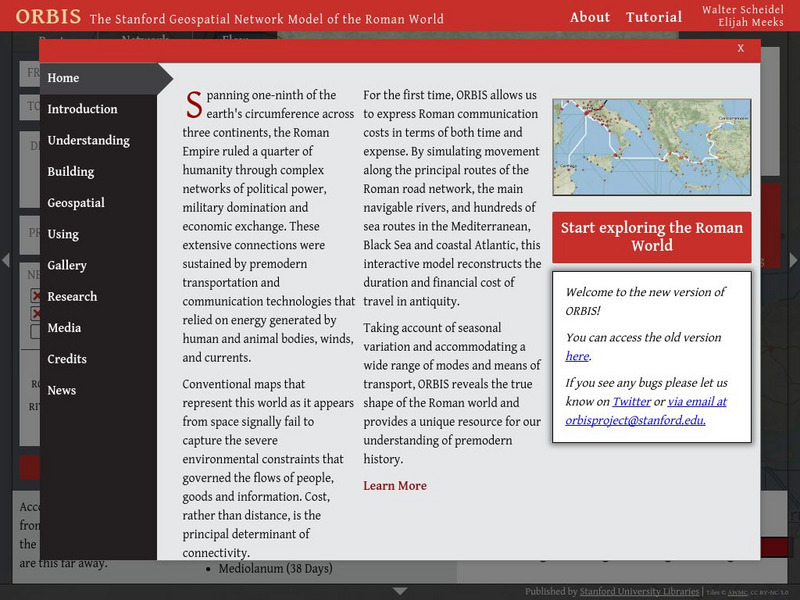
Orbis: The Stanford Geospatial Network Model of the Roman World
A geospatial model mapping the roads and trade routes of the Roman world reconstructs the time and cost associated with travel and trade around 200 CE.
Franco Cavazzi
Roman empire.net: Roman Empire Map
This site from Roman-Empire.net provides an interactive map of the Roman Empire. The expanse of the empire can be viewed by dates. The site can be searched by Provinces, Territories, Tribes, Towns, Cities, or Barbarian Incursions.
Friesian School
Fresian School: Animated History of Rome and Romania
This animated graphic, which is provided by the Fresian School, allows you to see how Rome grew and shrank between 300 BC and 1453 AD. The map changes in increments of about 50 years.
HyperHistory Online
Map Showing Kushan Empire and Silk Road
The map shows Kushan, the Silk Road, and Bactria between 100-200 CE.


